
Figure 3.
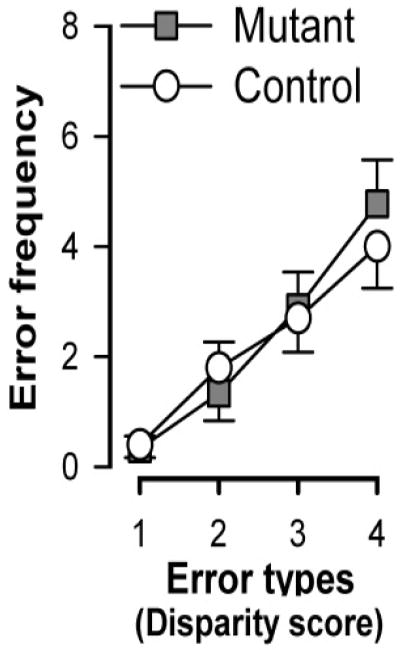
Frequency of errors classified as a function of the degree of disparity between two visits in the same arm for control and mutant mice based on the data obtained across the five days of test with the 8-arm protocol (Fig. 1B). The working memory errors were classified depending on the number of arms visited (disparity) between two visits into the same arm. For example, in the sequence of arm entries: ➀→➄→➂→➁→➁→➃→➈→➆→➃→➇ (where re-entry or working memory errors are underlined), the re-entry into arm ➁ is an error with disparity = 0 whereas the re-entry into arm ➃ is an error with disparity = 2. With increasing disparity, the frequency of error rises. This monotonic increase of error frequency as a function of the disparity did not differ between genotype. Error bars refer to ±SEM.