
Figure 2.
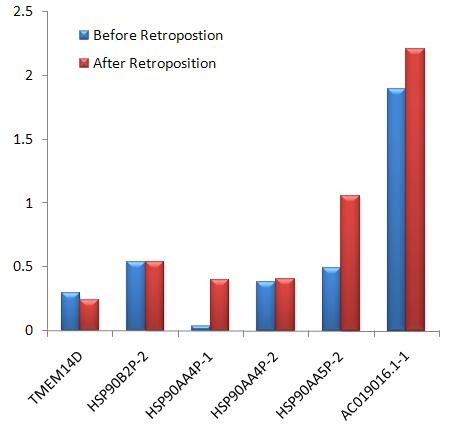
Comparison of splicing signals of retrogene introns (after retroposition) and their corresponding regions in the parental gene (before retroposition). The y-axis is the sum of the percentile scores of four different signals, comprising the branch site (BS), polypyrimidine tract (PPT), and 5′ and 3′ splice sites (Table 3). The higher the score, the stronger the splicing signal. Scores for BS and PPT were calculated with algorithm ‘K’ [47] and those for the splice sites were calculated with ‘M’ [48] by SROOGLE [41]. Six different retrogene introns are plotted on the x-axis. If a retrogene evolved only one intron (TMEM14D), we used the gene name to represent the intron, or we marked different introns in one retrogene in the format of the gene name plus a serial number following the hyphen. For example, ‘HSP90AA4P-1’ represents the first intron (in the direction from 5′ to 3′) in the retrogene HSP90AA4.