
Figure 1.
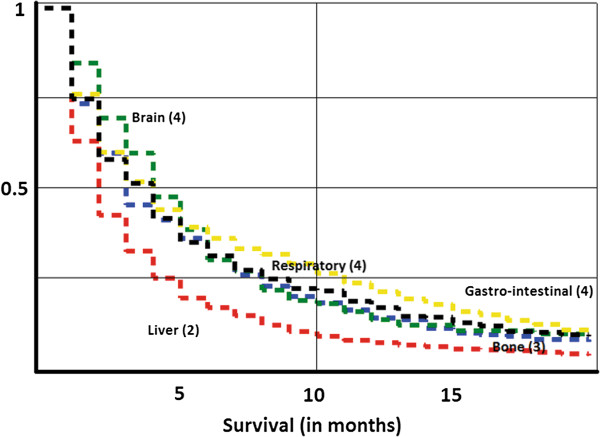
Kaplan-Meier survival curves for death in CUP, depending on the site of CUP metastases. Median survival times are displayed. Red = liver. Green = brain. Yellow = gastro-intestinal. Black = respiratory, Blue = bone.
Official websites use .gov
A
.gov website belongs to an official
government organization in the United States.
Secure .gov websites use HTTPS
A lock (
) or https:// means you've safely
connected to the .gov website. Share sensitive
information only on official, secure websites.
Kaplan-Meier survival curves for death in CUP, depending on the site of CUP metastases. Median survival times are displayed. Red = liver. Green = brain. Yellow = gastro-intestinal. Black = respiratory, Blue = bone.