
Figure 3.
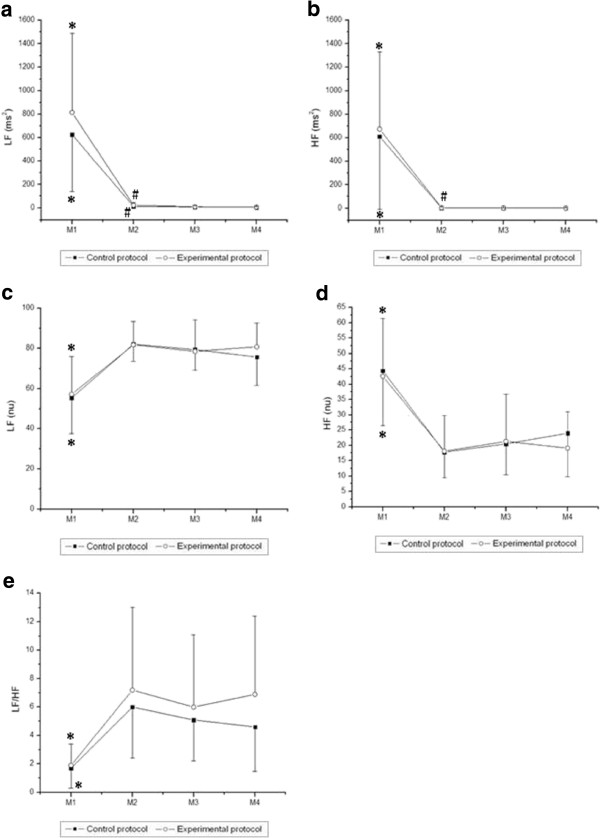
Values are means ± standard deviation. LFms2 (a), HFms2 (b), LFnu (c), HFnu (d) and LF/HF (e) during exercise and the comparison in control and experimental protocols. Final 5 minutes of rest (M1) and minutes of exercise: 25th to 30th (M2), 55th to 60th (M3), 85th to 90th (M4). *Different from M2, M3 and M4 (p<0.05). # Different from M4 (p<0.05).