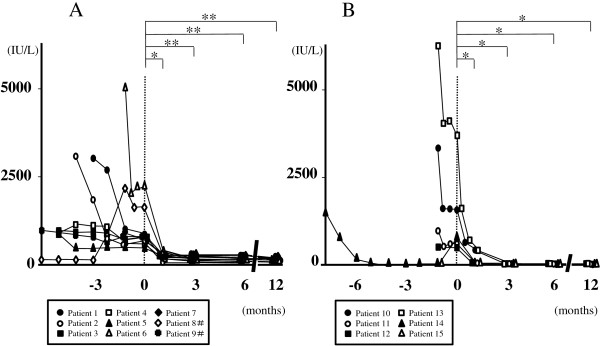
Figure 2.

Temporal profiles of serum CK from diagnosis in patients with PM (A) and those with DM (B), showing significant decreases 1, 3, 6 and 12 months after adding TAC compared with before (*p < 0.05 and **p < 0.01). Time point of adding TAC is indicated as 0. #Data of patients 8 and 9 are shown from 6 months before adding TAC.
