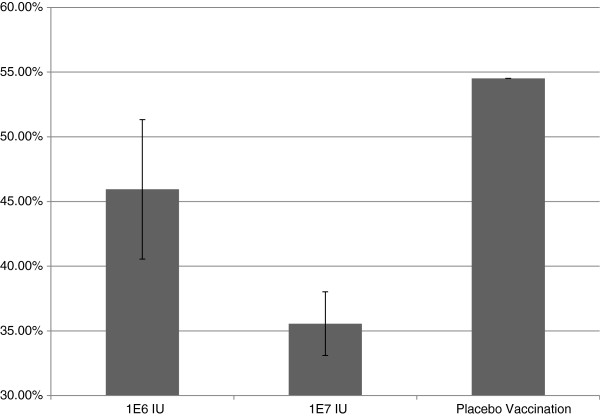
Figure 3.
Y-axis is percent depletion of circulating white blood cells when compared to pre-challenge baseline (set to 100%). The highest levels of depletion were seen in the placebo groups with a dose dependent decrease in WBC reduction in vaccinated groups. Error bars indicate standard error from mean percentage depletion.

