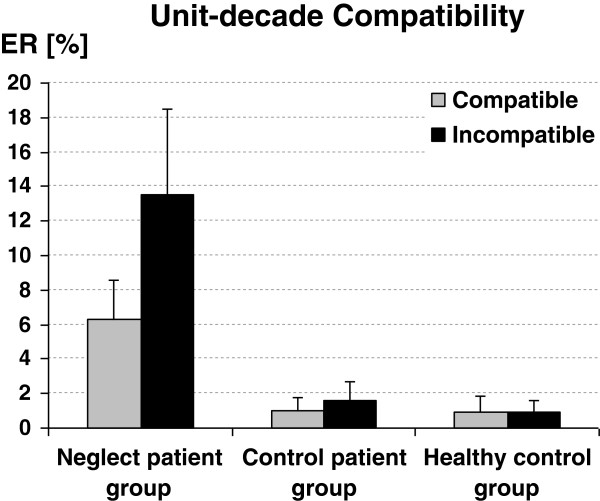
Figure 1.
Unit-decade compatibility effects. The compatibility effects (i.e., error rate for incompatible and error rate for compatible number pairs) depicted separately for neglect patients, non-neglect control patients, and healthy controls. Please note that the compatibility effect can only be assessed for between-decade comparisons. Error bars indicate 1 SEM.

