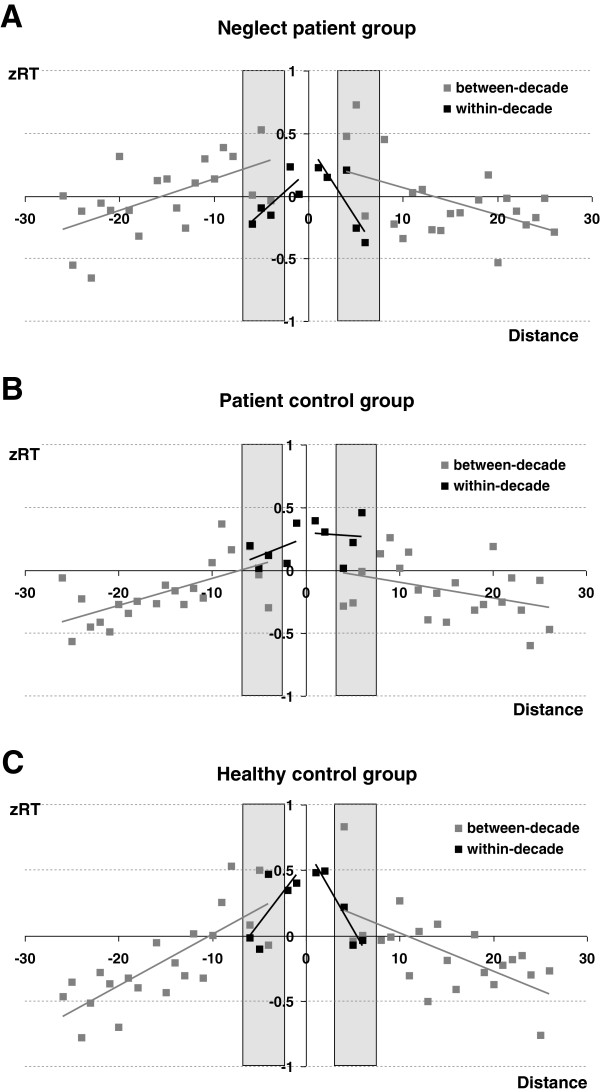
Figure 2.
The numerical distance effect. z-transformed RT separately for between- (grey squares) and within-decade items(black squares). The x-axis indicates the numerical distance between probe and standard with negative values indicating probes smaller than the standard. Grey boxes highlight the distances ± 4, ± 5, and ± 6 that can be contrasted directly for between- and within-decade items as they were measured redundantly for both item types. Panel A gives the results for neglect patients. Panel B for the patient control group, and Panel C for the healthy control group.

