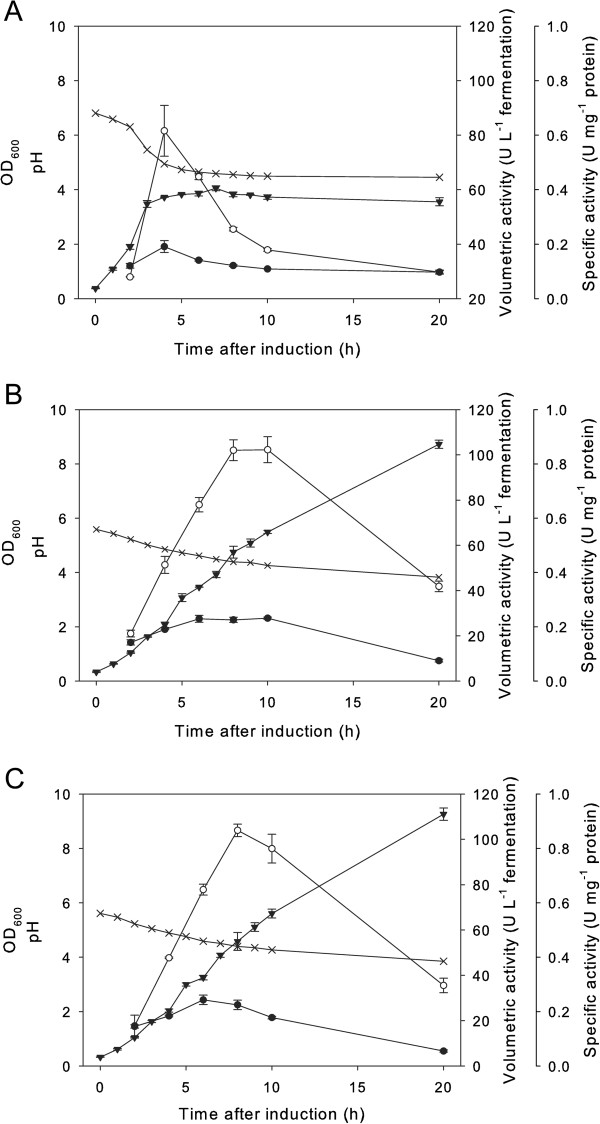
Figure 3.
Time course for growth of L. lactis NZ3900 or Lb. plantarum TLG02 cultivated without pH regulation. Panel A: L. lactis NZ3900/pVK51dkr; Panel B: Lb. plantarum/pSIP603dkr; Panel C: Lb. plantarum/pSIP609dkr. The graph shows OD600 (triangles down), pH (crosshairs), volumetric 2,5-DKG reductase activity (units per liter of fermentation broth) (circles white) and specific activity (units per milligram protein) (circles black).

