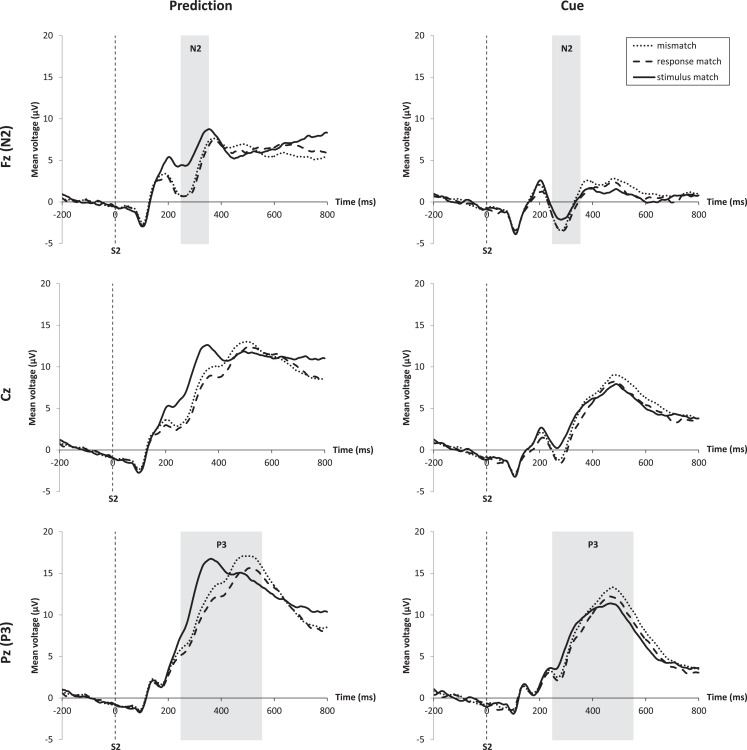
Figure 3.
ERPs at midline electrodes Fz, Cz, and Pz time-locked to stimulus onset. Prediction condition is shown on the left, cue condition on the right. For each electrode the different waveforms for the three match types are shown. Analysis windows for N2 and P3 components are highlighted in gray. Stimulus matches are marked by the solid line, response matches by the dashed line, and mismatches by the dotted line. The interaction of match and expectation condition can best be seen at the Fz electrode for the N2 and at the Pz electrode for the P3.

