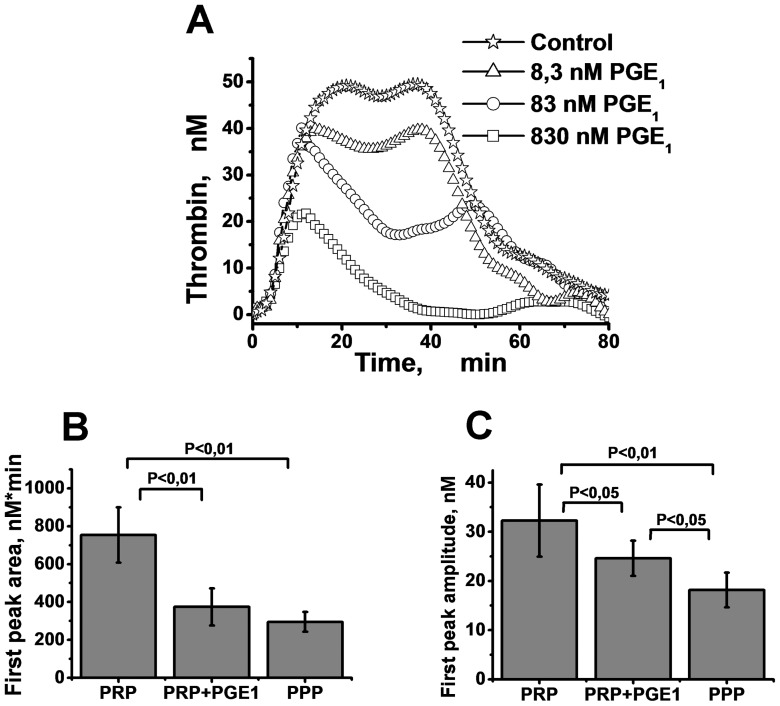
Figure 2. Influence of PGE1 on TG in PRP.
A: TGCs in PRP supplemented with 1.6% DMSO in the presence of different PGE1 concentrations. PRP without PGE1 was used as a control. B, C: The mean values of areas (B) and amplitudes (C) of the first peak in PRP, PRP with 830 nM PGE1 addition, and PPP. Coagulation was activated with 2 pM of TF. The platelet concentration was 100·103 platelets per µl. Mean values and SD are presented; n = 18, 8, and 7 for PRP, PRP+PGE1, and PPP, correspondingly. Student's t-test with P values equal to 0.05 and 0.01 was used to obtain statistics. The difference is not significant in all the bars where P-value is not presented.

