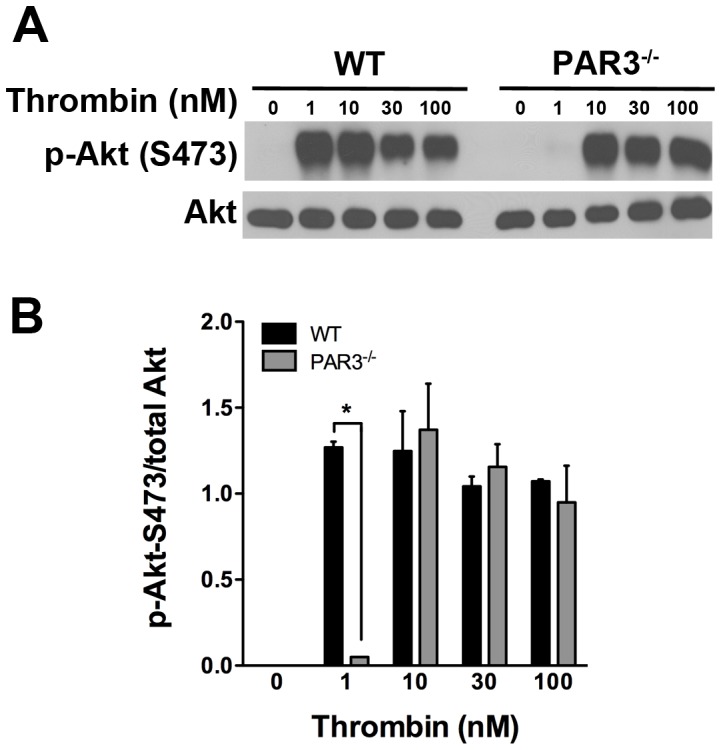
Figure 7. Western blot analysis of Akt phosphorylation in mouse platelets.

(A) The level of Akt phosphorylation at Ser473 in response to increasing concentrations of thrombin (1–100 nM) was determined by western blotting with phospho-Akt (Ser473) antibody. The membrane was re-probed for total Akt to demonstrate protein loading. The blots shown are from a representative of three independent experiments. (B) Quantitation of Akt phosphorylation at (Ser 473) in response to thrombin is represented at the mean (± SD, n = 3) (* p<0.05).
