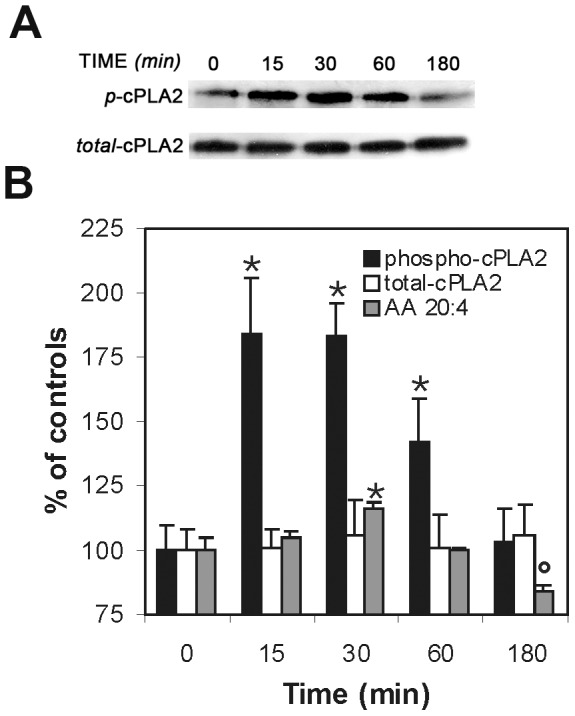
Figure 3. cPLA2 activation under PA supplementation.

(A) Western blot analyses of the effects of PA treatment on cPLA2 protein activation in its phosphorylated form in NB100 cells. Cells were examined after treatment for 15–180 min with 150 µM PA. Cell lysates were resolved by SDS/PAGE. Proteins were blotted and detected with monoclonal antibodies against cPLA2 or phospho-cPLA2. Representative gels are shown. (B) The bar graph represents the band intensity values obtained by the Image J analysis, expressed as percentage of the corresponding control (Time 0) (white bars: total cPLA2; black bars: phospho-cPLA2). AA quantity in membranes as % of control (grey bars) is obtained from Table 1. Results are mean ± SD of at least three independent experiments. Phospho-cPLA2 is significantly higher than controls at 15, 30 and 60 min (p<0.0001). AA is significantly higher at 30 min and significantly lower at 180 min (p = 0.001).
