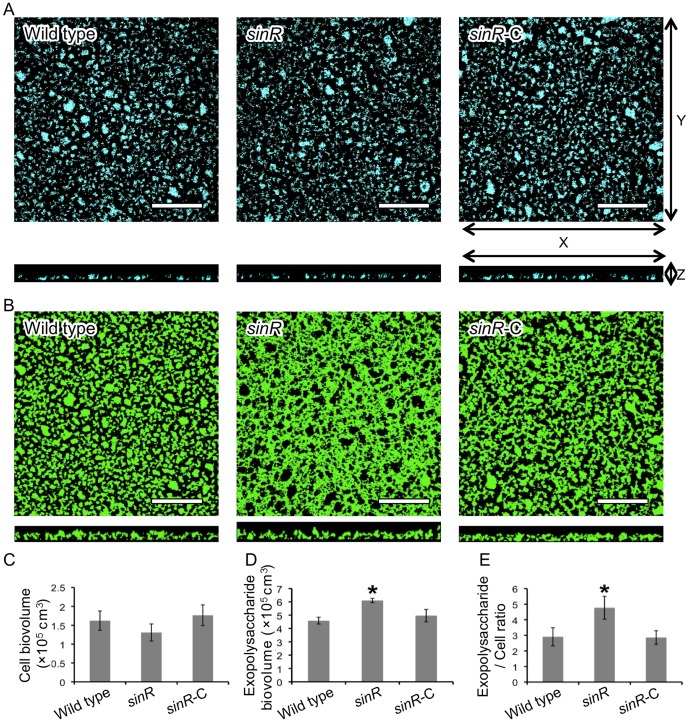
Figure 2. CLSM observation of biofilms formed by P. gingivalis strains.
P. gingivalis strains were stained with DAPI (blue) and incubated in PBS for 24 h. After washing, exopolysaccharide was stained with FITC-labeled concanavalin A and wheat germ agglutinin (green). P. gingivalis cells (A) and exopolysaccharides (B) of biofilms that developed on the coverglasses were observed with a CLSM equipped with a 40× objective. Scale bars represent 50 µm. Optical sections were obtained along the z-axis at 0.7-µm intervals, and images of the x-y and x-z planes were reconstructed with imaging software as described by Kuboniwa et al. [19]. Fluorescent images were quantified using Imaris software and the average of total cell biovolume per field (C) and that of total exopolysaccharide biovolume per field (D) were calculated. Furthermore, exopolysaccharide levels are expressed as the ratio of exopolysaccharide/cells (FITC/DAPI) fluorescence (E). The experiment was repeated independently three times. Data are presented as average of 8 fields per sample along with the standard errors of the mean. Statistical analysis was performed using a Welch's t test. *P<0.001 in comparison with the wild type strain.

