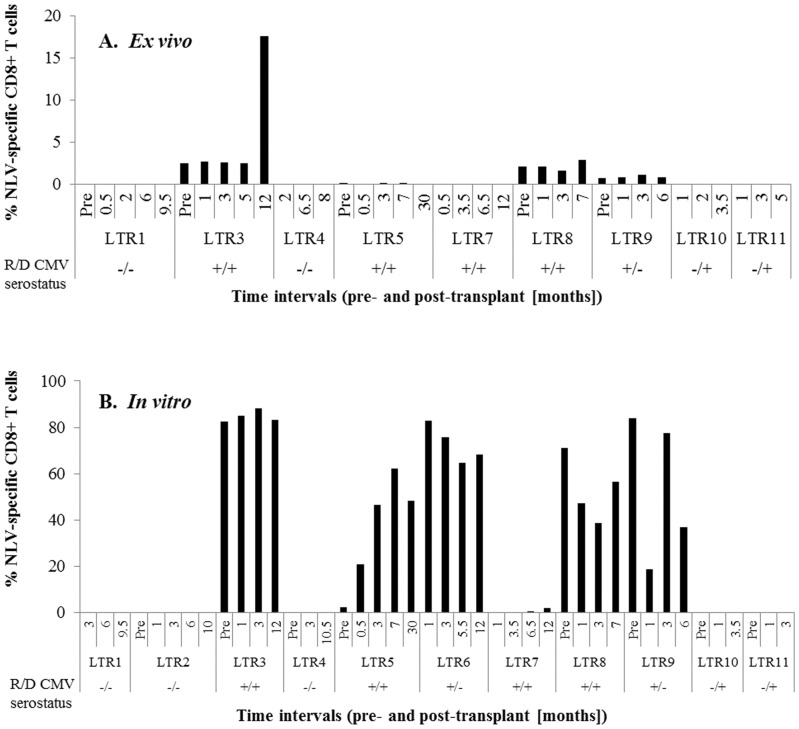
Figure 4. Expansion profiles of NLV-specific CD8+ T cells in LTR.
NLV-specific CD8+ T cell frequencies were measured on day 0 (A) and after 13 days of NLV peptide stimulation (B) based on the total CD8+ T cell population, where available. CMV serostatus of the recipients and donors are indicated in the graphs.

