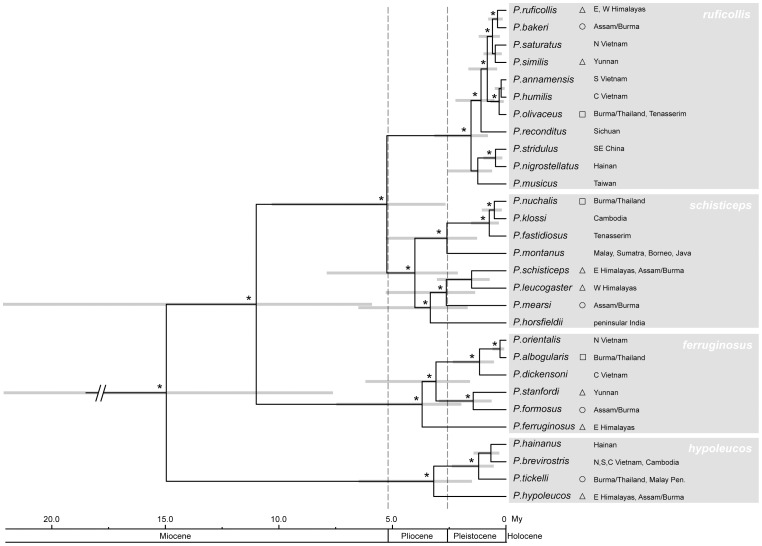
Figure 3. Phylogenetic hypothesis and chronogram of scimitar babbler relationships.
Ultrametric time calibrated topology based on the analysis of mitochondrial sequence data from 29 scimitar babbler taxa sampled in the study of Reddy and Moyle [17]. Horizontal grey bars at nodes represent 95% confidence intervals around node heights as generated in the program BEAST, and calibrated using a normally distributed prior on ND2 mutation rates (see Methods). Nodal support above 95% Bayesian posterior probability is indicated by an asterisk. The four main clades are highlighted in grey and labeled with their respective taxonomic designation. Taxa annotated by open triangles occupy Himalayan foothills, while open circles and open squares denote species occupying highlands at lower latitudes (Assam/Burma and Burma/Thailand, respectively).

