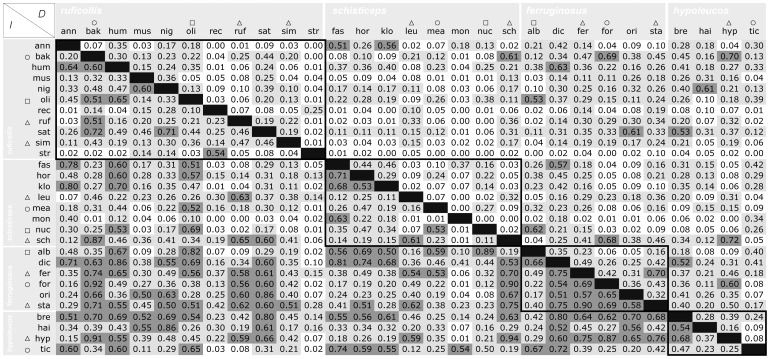
Figure 4. Niche overlap values between and within clades of Pomatorinus babblers.
Summary of geographic niche overlap values as calculated by the D (above diagonal) and I (below diagonal) statistics as outlined in Warren et al. [49]. Species are grouped by clades identified through the phylogenetic analysis outlined in Figure 3. Species abbreviations reflect the first three letters of their specific epithet, and taxa annotated by open triangles occupy Himalayan foothills, while open circles and open squares denote species occupying highlands at lower latitudes (Assam/Burma and Burma/Thailand, respectively). Boxed values represent overlap comparisons between taxa within their respective clades. Overlap values ranging from 0.11–0.50 are highlighted in light grey, while values above 0.50 are highlighted in dark grey.

