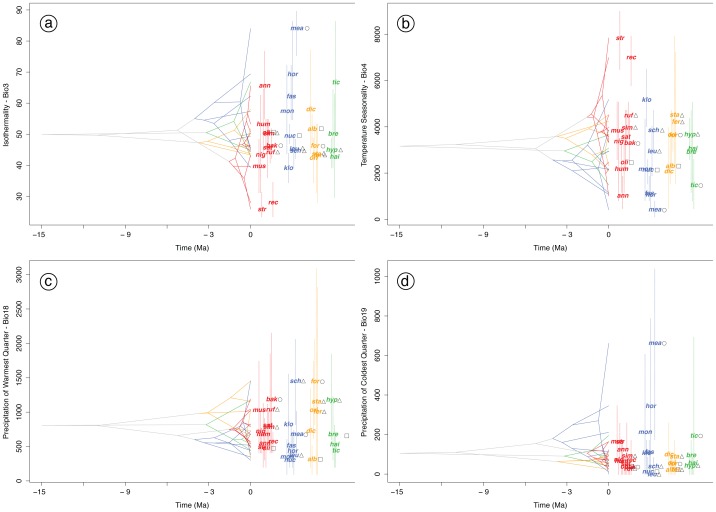
Figure 6. History of evolution of climatic tolerances Pomatorhinus scimitar babblers.
The maximum a posteriori chronogram topology produced by the BEAST analysis and the PNO profiles of four ecological variables have been integrated to represent the reconstruction of mean climatic tolerances based on 100 random samples of the PNO profiles at internal nodes. Panel (a) depicts the evolution of Isothermality (Bio3), (b) reconstructs Temperature Seasonality (Bio4), while (c) summarized the evolution of Precipitation of the warmest quarter (Bio18), and (d) of Precipitation of the coldest quarter (Bio19). Members of the four main Pomatorhinus clades are colored red (ruficollis), blue (schisticeps), yellow (ferruginosus), and green (hypoleucos). The three letter codes abbreviating the specific epithets of each species are positioned at the mean of the 80% central density. Taxa occupying Himalayan foothills are denoted by open triangles, Assam/Burma highlands by open circles, and Burma/Thailand highlands are represented by open squares. Overlapping internal nodes indicate convergent climatic origins, while crossing branches of the phylogenetic tree indicate convergent niche evolution among taxa from different clades. See also Figure S3 for plots of evolution of climatic tolerances of all 10 bioclimatic variables used in niche modeling algorithm of the present study.

