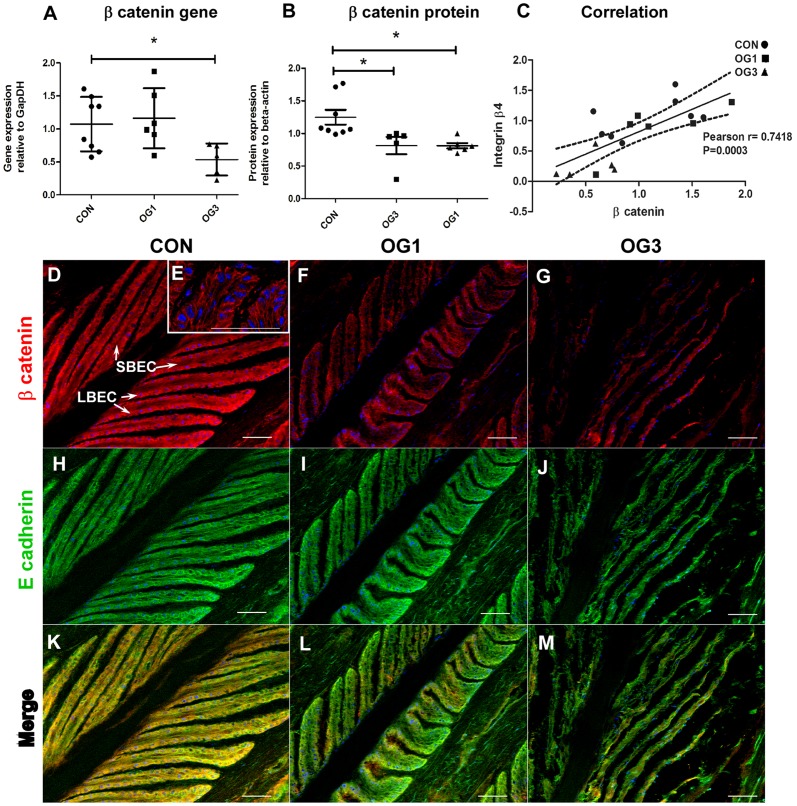
Figure 2. Distribution and expression of β-catenin and E-cadherin in digital laminae of healthy and laminitic horses.
A - Quantitation of β-catenin gene expression relative to the gene expression of GapDH. B - Quantitation of β-catenin protein expression relative to the protein expression of β actin. Horizontal lines indicate mean ± standard error of mean * = p<0.05 as calculated by one-way ANOVA. C - Correlation between expression of genes encoding β-catenin and integrin β4: Pearson r = 0.7418, p = 0.0003. Solid line represents the predicted positive correlation by linear regression; Area within the dotted lines represents 95% confidence. n = 8 CON, n = 6 OG1, and n = 5 OG3. D-M (20X objective) - 10 µm sections of frozen laminae from: D, H, K - a representative (n = 3) healthy horse (CON) (D – LBEC = laminar basal epithelial cell, SBEC = supra-basal epithelial cell) ; F, I, L - a representative (n = 4) horse with OG1-lameness (OG1) and G, J, M - a representative (n = 3) horse with OG3-lameness (OG3) were stained with antibodies against β-catenin (D, F, G- red) and E-cadherin (H, I, J - green). Red and Green fluorescence merge in yellow (K, L, M). Nuclei are stained blue with DAPI. Scale bars 50 µm. E (63X objective) – β-catenin stained in red, nuclei stained blue.

