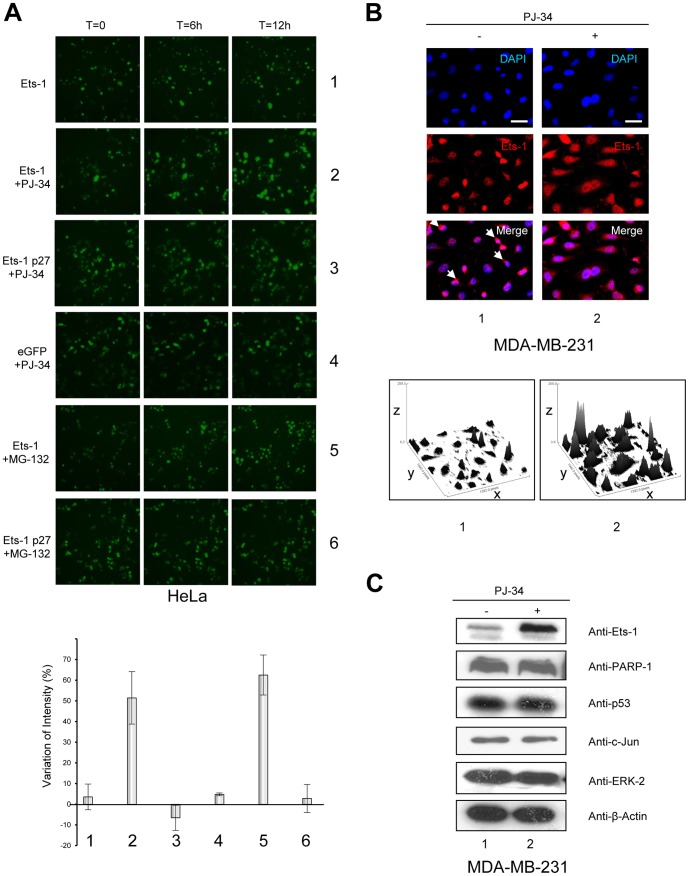
Figure 4. Inhibition of PARP-1-mediated PARylation induces the accumulation of Ets-1 protein.
(A) Kinetics of Ets-1 accumulation observed by time-lapse imagery. HeLa cells were grown in MatTek dishes and were transfected with peGFP-C1-Ets-1 (500 ng; rows 1, 2 and 5) or peGFP-C-1-Ets-1p27 (500 ng; rows 3 and 6) or empty peGFP-C1 vectors (500 ng; row 4). 24 h after transfection, HeLa cells were treated with PJ-34 (10 µM; rows 2–4) or MG-132 (5 µM; rows 5 and 6) and observed for 12 h under a fluorescence microscope at ×20 magnification with one picture taken every hour. Bottom panel: Statistical analysis of the variation of fluorescence intensity. Conditions 1 to 6 indicated on the x-axis are the same as those described above. Mean fluorescence intensities from time-lapse experiment pictures were calculated using ImageJ software and the ratio of variation was established between the T = 12 h and T = 0 pictures. Results are the average of three experiments. (B) Visualisation of Ets-1 protein levels in MDA-MB-231 cells treated with PJ-34 by immunofluorescence. MDA-MB-231 cells were treated with PJ-34 (10 µM) for 20 h. Ets-1 is visualised in Red (Alexa Fluor® 594). Cells were examined under a fluorescence microscope at ×40 magnification. Scale bar = 20 µm. White arrows indicate cytoplasmic localisation of Ets-1 in untreated cells (lane 1). Bottom panel: Surface plot representations. Surface plots were obtained by analysing immunofluorescence pictures using ImageJ software; the x- and y-axes indicate the pixel positions and the z-axis, the intensity of fluorescence. (C) Effect of PARP-1 catalytic inhibition on the level of PARylated proteins. MDA-MB-231 cells were treated with PJ-34 (10 µM) for 20 h. Cell lysates (30 µg total proteins) were analysed by Western blot using different antibodies (see Materials and Methods) against PARP-1, p53, c-Jun and ERK-2 which are known to undergo PARylation.

