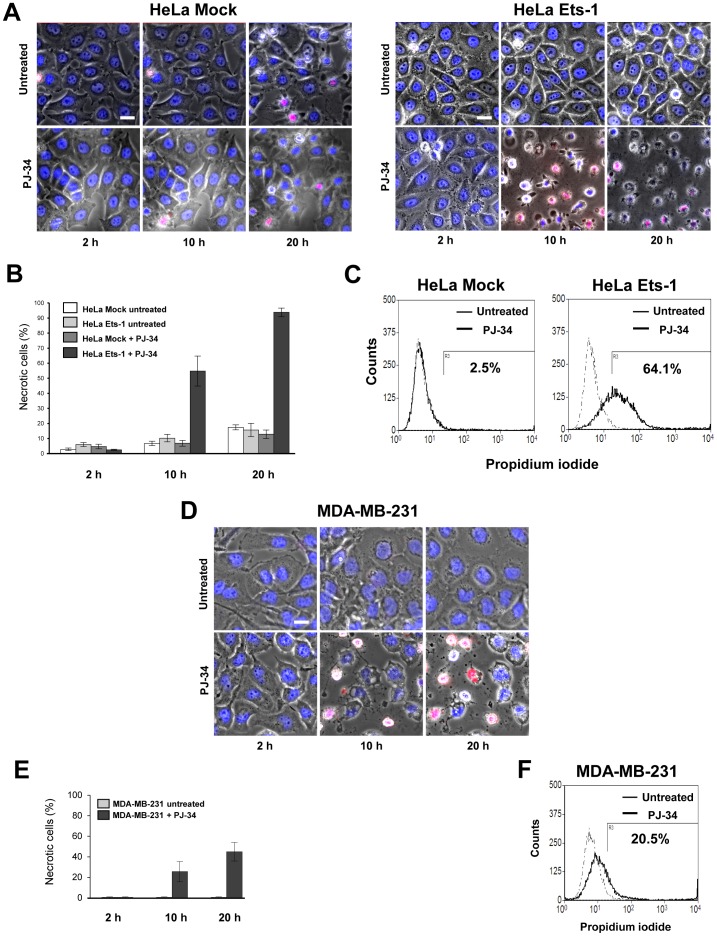
Figure 5. Ets-1 expression leads to cancer cell death under PARylation inhibition.
(A) Time-lapse imaging experiments of HeLa cells treated with PJ-34. HeLa cells were grown in Hi-Q4 dishes until 70% confluence and transfected with empty pcDNA3 (250 µg; left panel) or pcDNA3-Ets1 (250 µg; right panel) vectors 24 h before being treated with PJ-34 (5 µM) or left untreated. Cells were stained with Hoechst 33242 (blue) and PI (red) for live-cell imaging and monitored for 20 h. Scale bar = 20 µM. (B) Graphical representation of the proportion of necrotic HeLa cells (%) at three time points (see Materials and Methods). (C) Flow cytometry cell-death detection of HeLa cells treated with PJ-34. HeLa cells were grown in 6-well plates until 70% confluence and transfected with pcDNA3 (1 µg; left panel) or pcDNA3-Ets1 (1 µg; right panel) vectors for 24 h and left untreated (dashed lines) or treated with PJ-34 (solid lines) for an additional 20 h incubation. Necrotic cell death was then determined by flow cytometry after PI staining. Numbers under the horizontal bar give the percentages of specific PJ-34-induced necrotic cell death in each condition. Flow cytometry profiles shown are representative of three replicate experiments. (D) Time-lapse imaging experiments of MDA-MB-231 cells treated with PJ-34. MDA-MB-231 cells were grown in Hi-Q4 dishes until 80% confluence and treated with PJ-34 (10 µM) or left untreated. Cells were stained with Hoechst 33242 (blue) and PI (red) for live-cell imaging and monitored for 20 h. Scale bar = 20 µM. (E) Graphical representation of the proportion of necrotic MDA-MB-231 cells (%) at three time points (see Materials and Methods). F) Flow cytometry cell-death detection of MDA-MB-231 cells treated with PJ-34. MDA-MB-231 cells were grown in 6-well plates until 80% confluence and left untreated (dashed lines) or treated with PJ-34 (solid lines) for a 20 h incubation. Necrotic cell death was then determined by flow cytometry after PI staining. Numbers under the horizontal bar represent the percentages of specific PJ-34-induced necrotic cell death in each condition. Flow cytometry profiles shown are representative of three replicate experiments.

