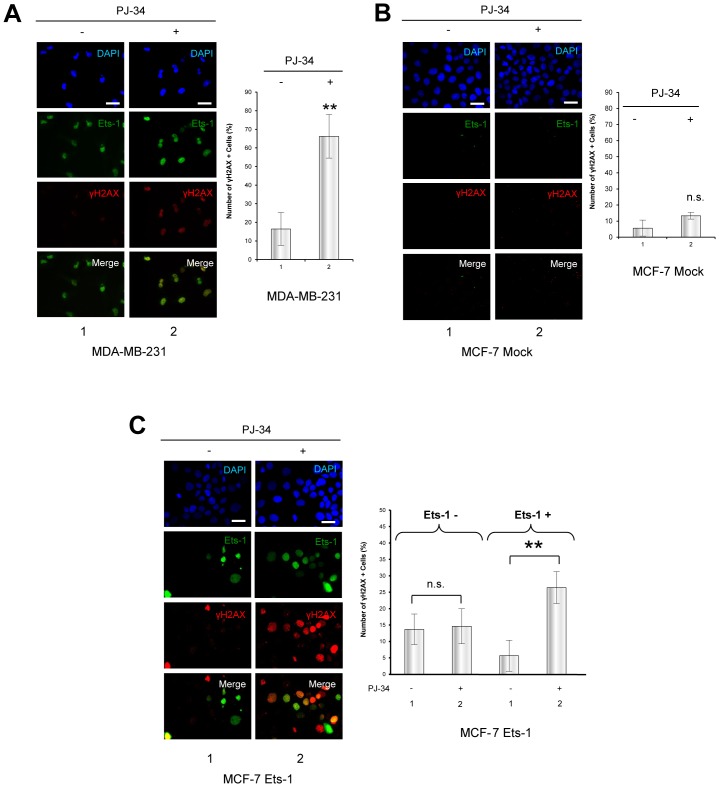
Figure 7. Ets-1 expression causes DNA damage mediated by PARP-1 catalytic inhibition in breast cancer cells.
(A) Immunofluorescence of γH2AX in MDA-MB-231 cells after treatment with PJ-34. MDA-MB-231 cells were treated with PJ-34 (10 µM) for 20 h. Ets-1 is visualised in green (Alexa Fluor® 488) and γH2AX in red (Alexa Fluor® 594). Nuclei were visualised with DAPI staining. Cells were examined by fluorescence microscopy at ×40 magnification. Scale bar = 20 µm. Statistical analysis was performed by counting and examining after immunofluorescence more than 100 cells from three different experiments. γH2AX + indicates cells with more than 10 γH2AX foci in their nucleus (Fig. S6). All MDA-MB-231 cells are positive for Ets-1 expression (Ets-1 +). In the graph, the percentage of γH2AX + cells is given. ** p<0.01. (B) Immunofluorescence of γH2AX in MCF-7 cells after treatment with PJ-34. MCF-7 cells were treated with PJ-34 (10 µM) for 20 h. Ets-1 is visualised in green (Alexa Fluor® 488) and γH2AX in red (Alexa Fluor® 594). Statistical analysis was performed by counting and examining after immunofluorescence more than 100 cells from three different experiments. All MCF-7 cells are negative for Ets-1 expression (Ets-1 -). In the graph, the percentage of γH2AX + cells is shown. (C) Immunofluorescence of γH2AX and Ets-1 in Ets-1-transfected MCF-7 cells after treatment by PJ-34. MCF-7 cells were transfected with peGFP-C1-Ets-1 expression vector (1 µg) and treated with PJ-34 for 20 h. γH2AX is visualised in red (Alexa Fluor® 594) and Ets-1 in green (eGFP). Statistical analysis was performed as described in (A). In the graph, the percentage of γH2AX + cells is shown for the Ets-1 – and Ets-1 + cell populations. ** p<0.01. In (A) and (B), nuclei were visualised with DAPI staining. Cells were examined by fluorescence microscopy at ×40 magnification. Scale bar = 20 µm.

