
Figure 2. Principal coordinates analysis clusters the 48 subsample communities by biological sample.
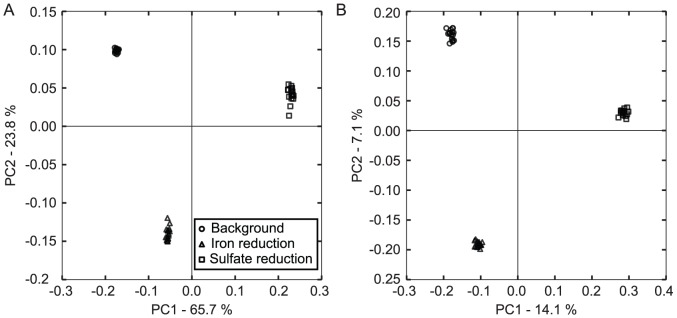
EMIRGE-reconstructed rRNA genes were used to construct a phylogenetic tree. From this tree, pairwise distances were calculated between each of the 48 subsample communities using either abundance-weighted (A) or unweighted (B) Unifrac, and principal coordinates analysis was used to reduce the dimensionality of the resulting distance matrices for visualization. Percentage variation explained by each principal coordinate is shown for each axis. Subsample communities clearly separate by biological sample. Weighted Unifrac accounts for a larger fraction of the variance in the first two principle coordinates than unweighted unifrac, indicating that changes in abundances are particularly informative.