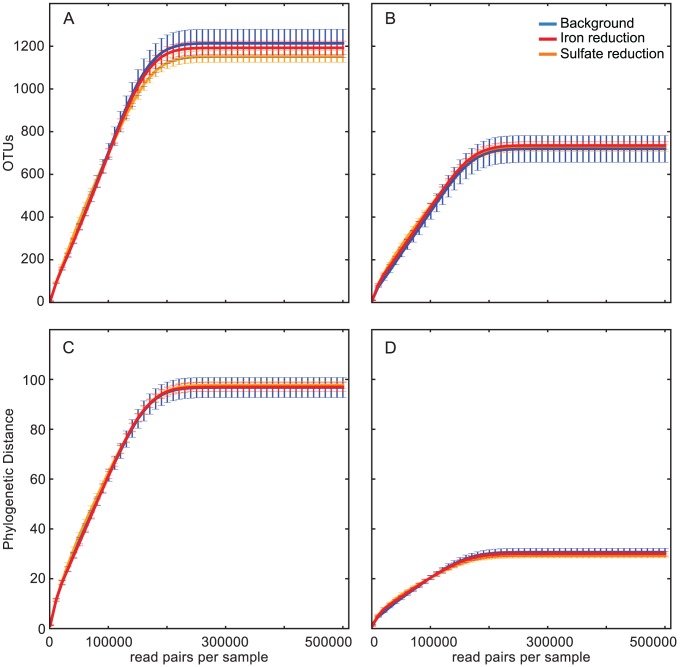
Figure 4. Alpha diversity of communities inferred by full-length rRNA and hypervariable-regions.
Alpha diversity metrics are shown for EMIRGE-reconstructed full-length OTUs (A, C) and OTUs based on in silico-extracted V3 regions from the EMIRGE-reconstructed sequences (B, D). A and B show the total number of OTUs identified with increasing sequencing effort. C and D show the total tree phylogenetic distance (PD) observed with increasing sequencing effort. Plots show the mean and standard deviation of 10 samples per simulated sequencing effort. Blue: background; red: iron reduction; orange: sulfate reduction.

