
Figure 2. Gene Ontology Slim terms gene counts of the differentially expressed genes.
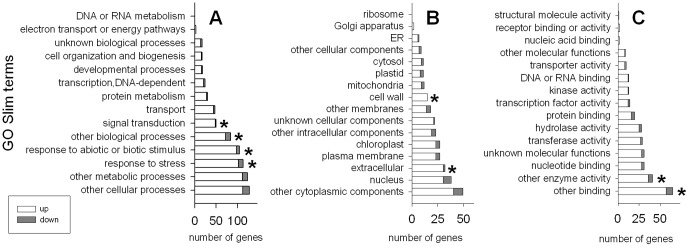
Gene Ontology Slim terms gene counts for biological process (A), cellular component (B) and molecular function (C) of the differentially expressed genes (plants grown in compost vs. perlite). Up-regulated in white and down-regulated in gray. An asterisk indicates over-represented terms when comparing the abundance of the term in the pool of significant genes and in the whole microarray chip by Fisher's exact test (P<0.05, applying Bonferroni's correction).