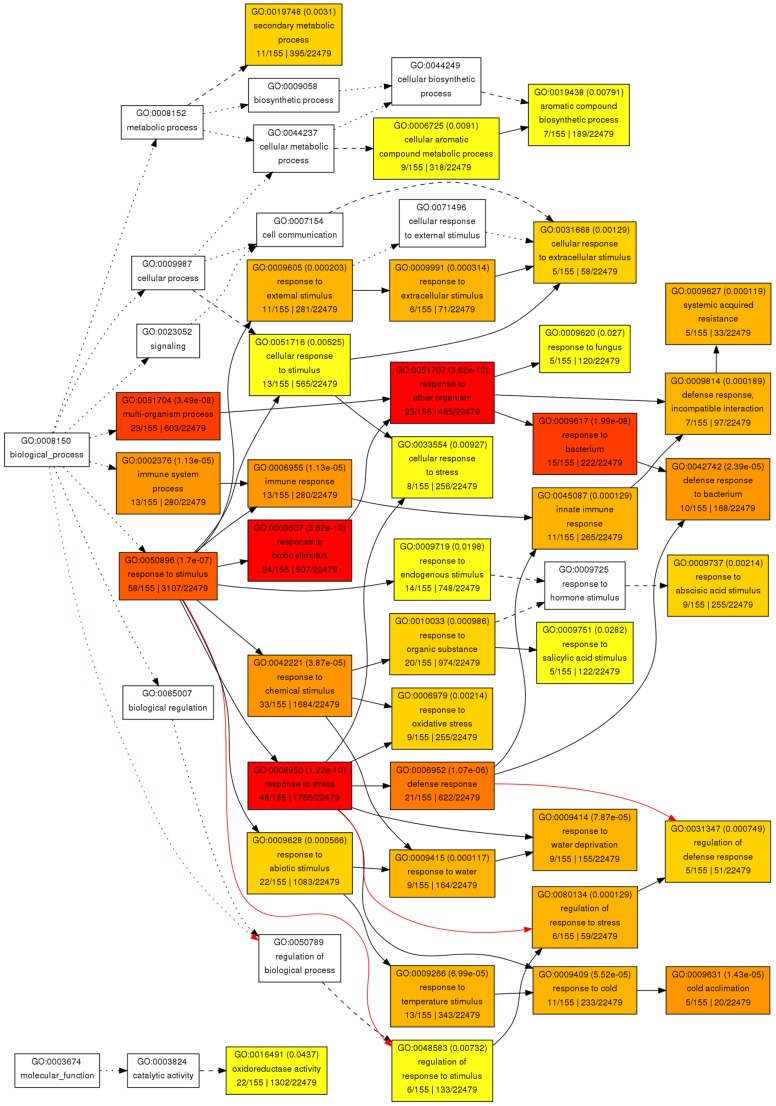
Figure 3. Hierarchical tree graph of over-represented GO terms in up-regulated genes by singular enrichment analysis generated by agriGO.
Boxes in the graph show GO terms labeled by their GO ID, term definition and statistical information. The significant terms (adjusted P<0.05) are marked with color, while non-significant terms are shown as white boxes. The degree of color saturation of a box correlates positively with the enrichment level of the term. Solid, dashed and dotted lines represent two, one and zero enriched terms at both ends connected by the line, respectively. A red line indicates positive regulation. The rank direction of the graph runs from left to right.

