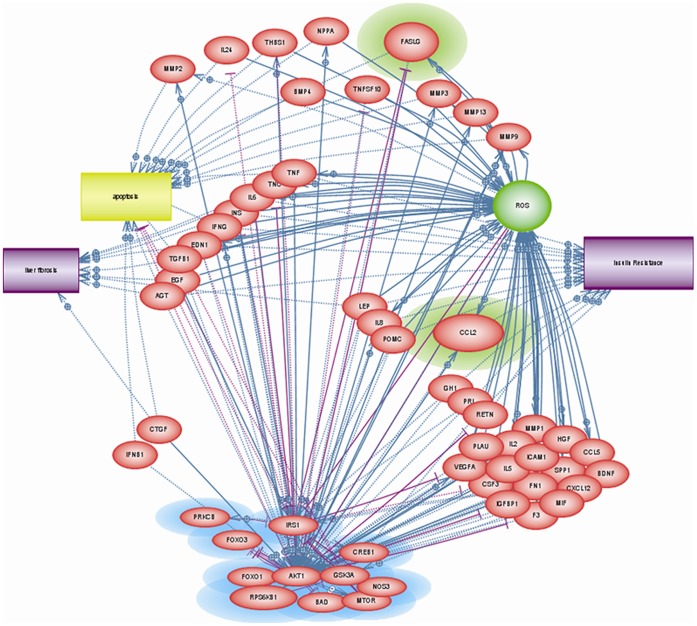
Figure 1. Final output network based on analyses performed in Pathway Studio.
Proteins highlighted in blue were differentially phosphorylated in the phosphoproteomic data set.24 Proteins selected for testing in the NASH and NASH-related fibrosis biomarker panel are highlighted in green (Fas ligand and CCL2).

