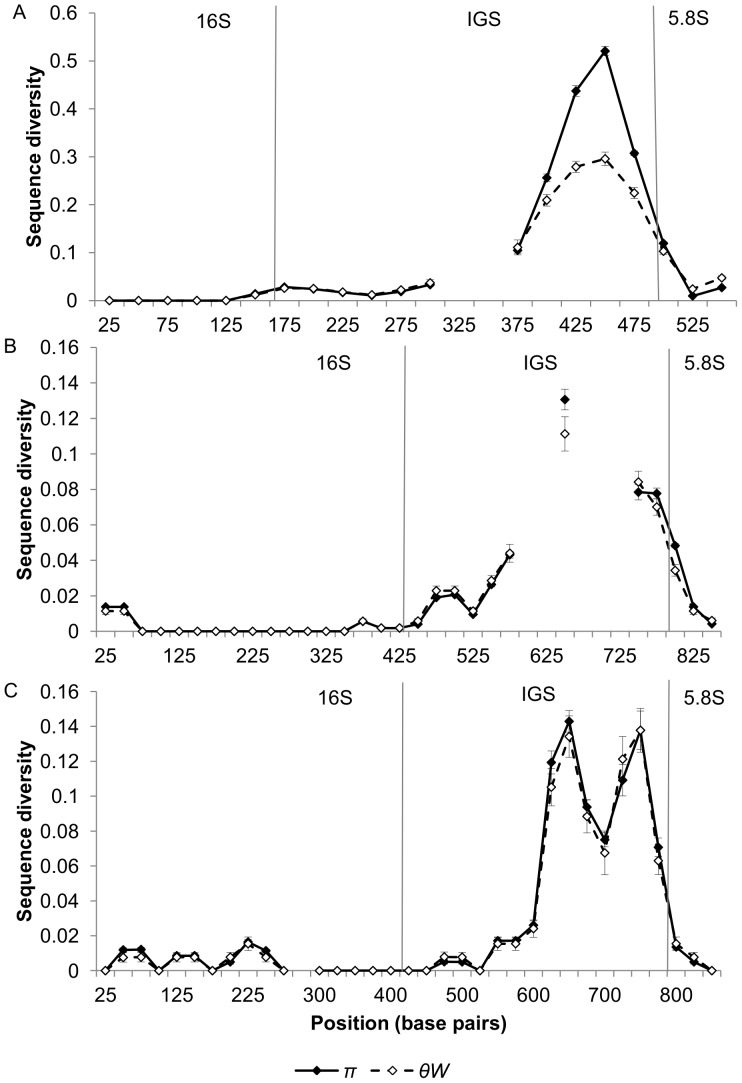
Figure 2. Sliding window analysis of nucleotide diversity in the IGS and flanking 16S and 5.8S rDNA regions of N. bombycis (Part A), N. granulosis (Part B) and V. cheracis (Part C).
A sliding window of 50 base pairs is used, with an increment of 25 base pairs. Nucleotide diversity is calculated as the average heterozygosity per site (π) and the average number of nucleotide differences per site (θW). Error bars show the standard error for each window. Regions in which sequences could not be aligned due to multiple insertions and deletions are indicated by missing data (breaks in the line).

