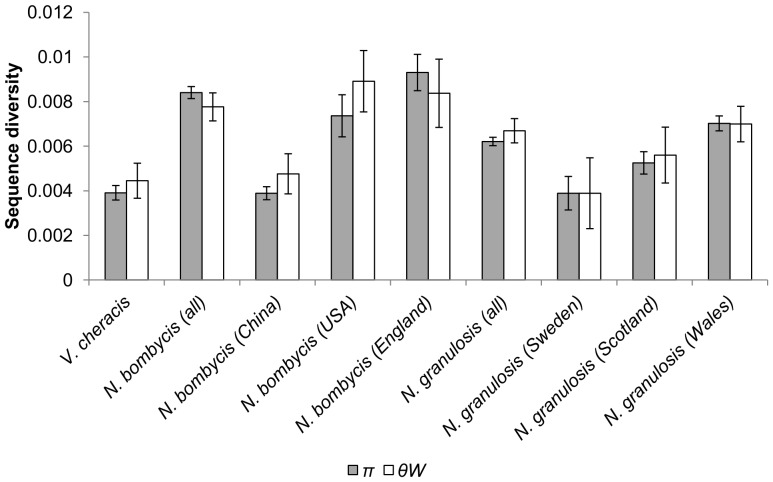
Figure 4. Nucleotide diversity of the IGS and flanking 16S and 5.8S rDNA regions of N. bombycis, N. granulosis and V. cheracis isolates.
Nucleotide diversity is calculated as the average heterozygosity per site (π) and the average number of nucleotide differences per site (θW). Error bars show the standard error for each isolate.

