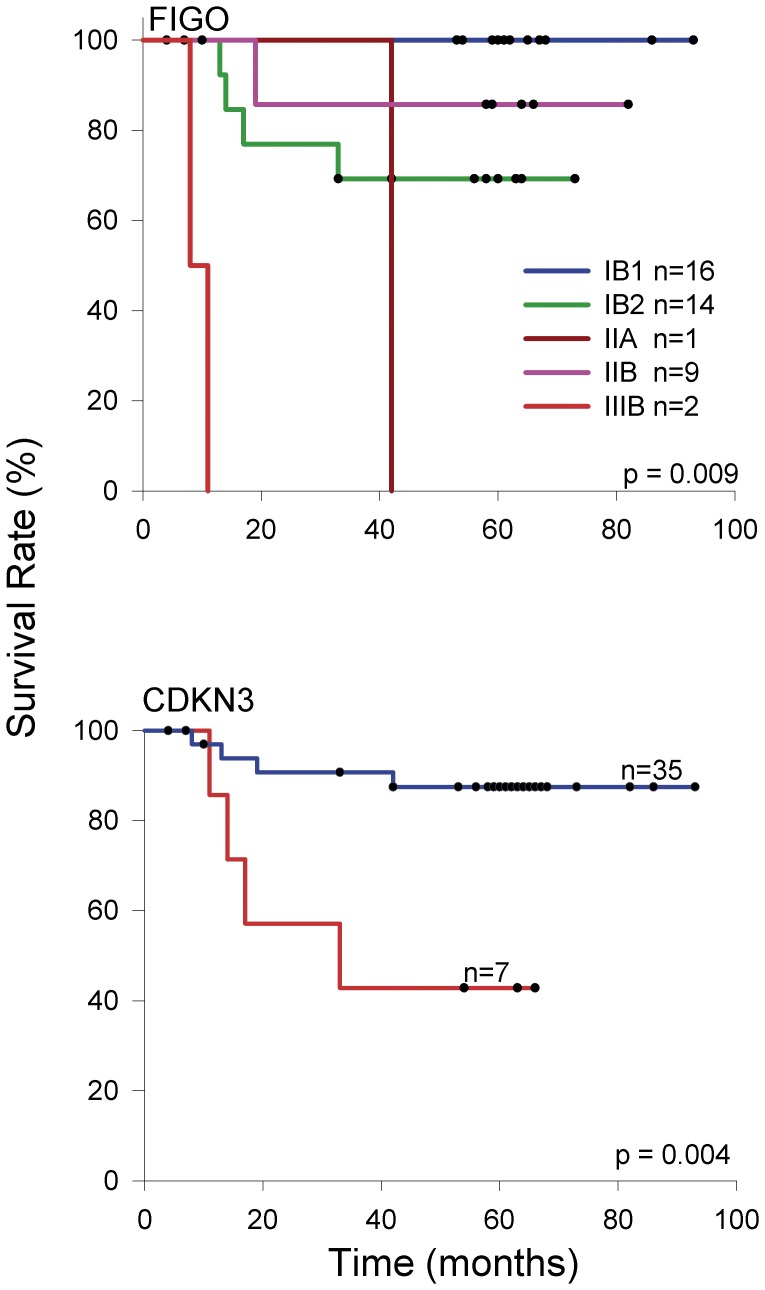
Figure 7. Survival analysis of women with cervical cancer according to FIGO staging and CDKN3 expression.
The Kaplan-Meier curves for FIGO staging and CDKN3 are shown. Patients were followed-up for at least 42 months. For gene expression, cancer patients with higher (red line) and lower (blue line) fold change values were compared (see material and methods). The p value was calculated by comparing the curves with the log-rank test. Censored patients are labeled with black dots, but only four of them were censored before the minimal period of follow-up (42 months).

