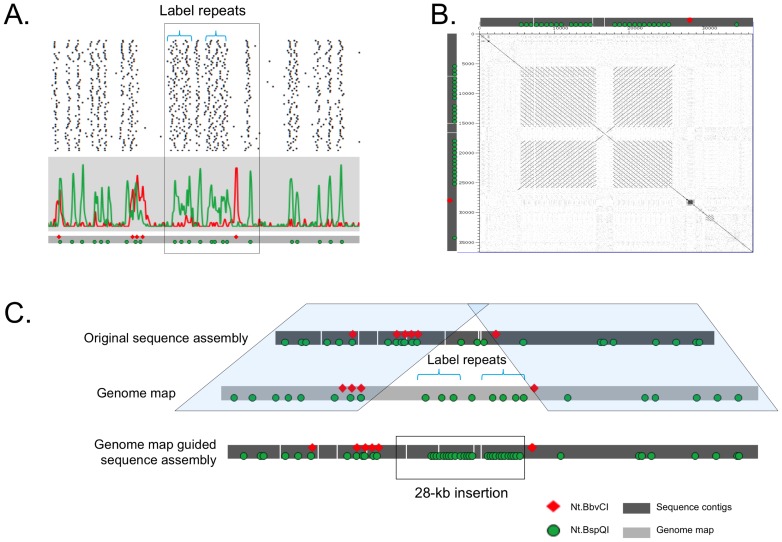
Figure 6. Identification and assembly of repeat sequences in genome map-guided de novo sequence assembly.
Panel A shows the strip diagram for one of the clones that covers the high density region, each line represents a different molecule and the spots are the location of green (Nt.BspQI) labels. Two high-density label regions are marked “label repeats,” and they do not cluster into discrete peaks. Panel B shows a pairwise alignment of the high-density region after reassembly based on the genome map. The alignment shows two blocks of direct repeats which are inverted with respect to one another. Panel C shows the original assembly on the top, the genome map in the middle and the final assembly on the bottom, containing the repeat sequence as predicted by the genome map.

