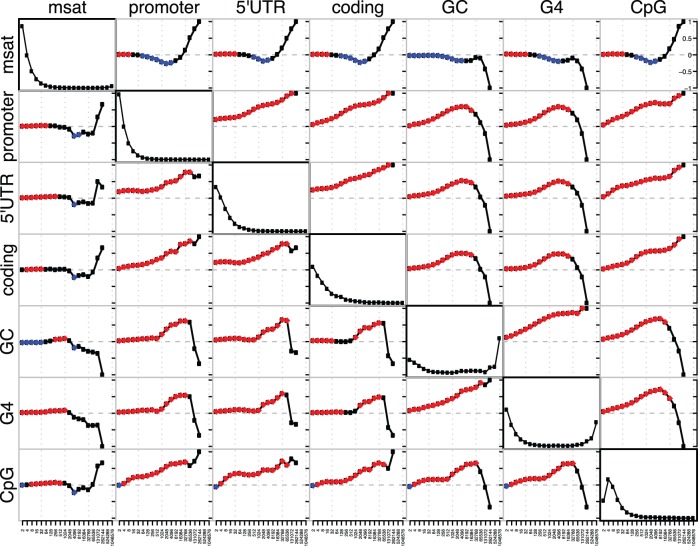
Figure 2. Kendall rank correlations between wavelet coefficients.
The pairwise correlations between smooth coefficients are in the top right, and detail coefficients are the bottom left. The diagonal displays the normalized power spectrum for the wavelet coefficients, which can be interpreted as a measure of the variation of each signal at each scale. Note that the majority of factors examined here have most of their variation at the finest scales, while GC content and G4 elements contain a large amount of variation at the largest scales. Abbreviations for each element are “msat” for microsatellite, “G4” for predicted G4 regions, “CpG” for CpG islands, and “GC” for G/C content. Associations with a p-value above 0.001 are shown in red if positive, blue if negative. The smallest scale examined was 1 kb in size, and each successive scale increases by a factor of two.

