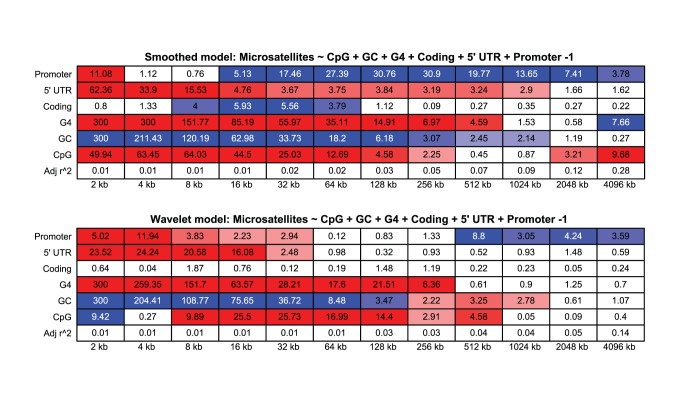
Figure 3. Linear model of wavelet results, displaying  p-values.
The top figure shows the results of the smooth coefficients, the bottom shows the results of the detail coefficients. Positive relationships are shown in red, negative in blue. The  value is shown at the bottom of the figure. The largest scales were not included in this figure for simplicity.

