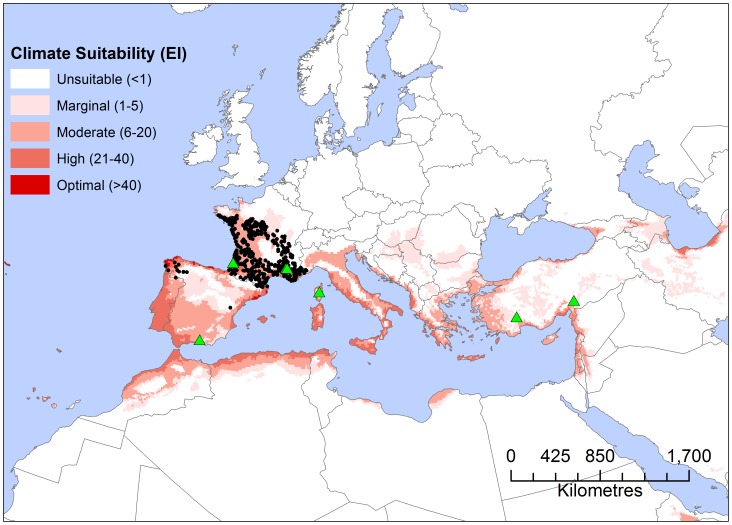
Figure 3. Europe showing known and potential range of occurrences of Thaumetopoea pityocampa.
Thaumetopoea pityocampa up to 1990 (black dots) and modelled climatic suitability for T. pityocampa under historical (1961–1990) climate averages as modelled using CLIMEX Ecoclimatic index (EI). Projection: Albers equal-area. Green triangles are locations from which impact data has been reported.

