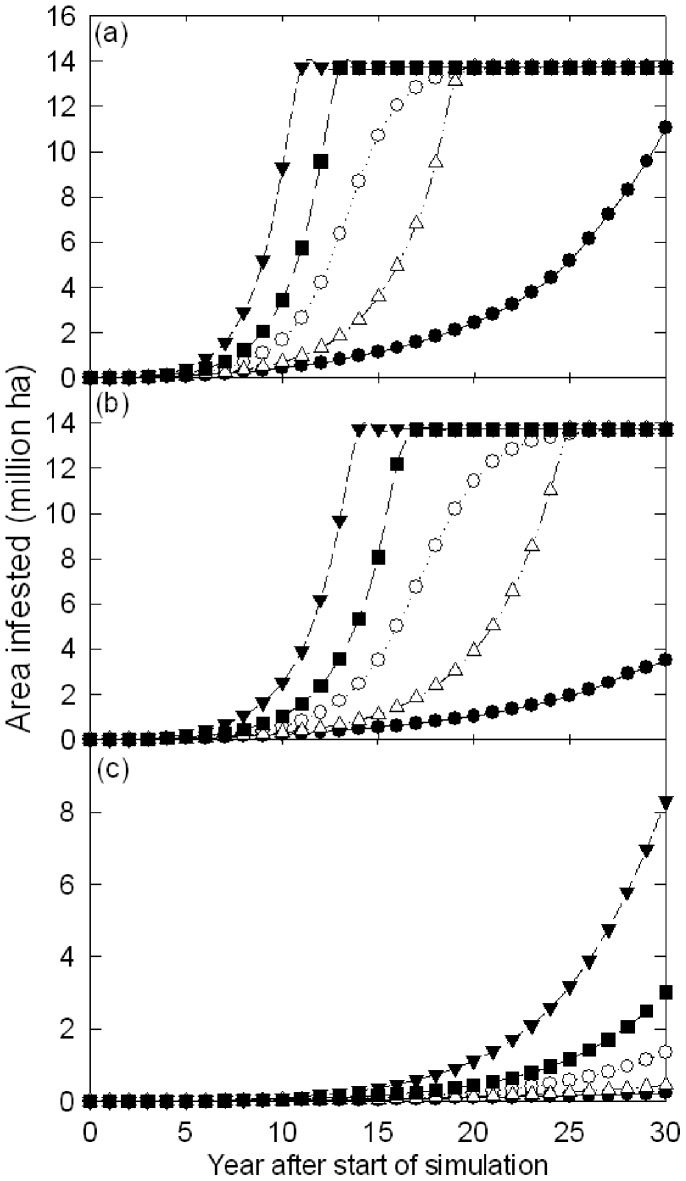
Figure 7. Change in area infested by Thaumetopoea pityocampa from the simulation start under the (a) no control (b) little control and (c) good control spread scenarios.
On all figures the lines represent trajectories from spread simulations showing the minimum, (filled circles), maximum (filled triangles), 5th (open triangles), 50th (open circles), and 95th (closed squares) percentiles. Note the variation in scale between figure panels.

