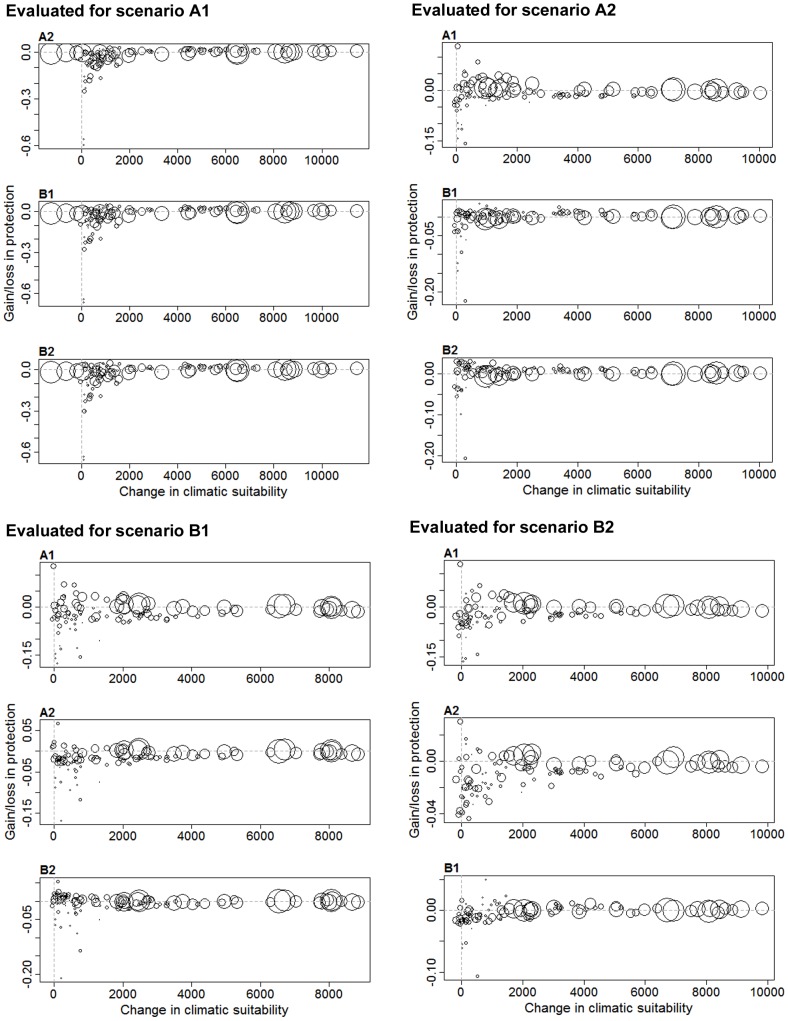
Figure 4. Relative losses and gains for a combination of planning and evaluation scenarios, indicated by negative (loss) and positive (gain) values in the y axis.
Circles are species and circle size reflects the sum of baseline climatic suitability across cells. Panels A–D correspond to evaluation scenarios A1, A2, B1, and B2 respectively. Graphs within these panels correspond to the planning scenarios. Species are distributed along the x axis according to the expected change in future climatic suitability according to the evaluation scenario. Negative values in the x axis indicate species expected to experience a decrease in future climatic suitability.

