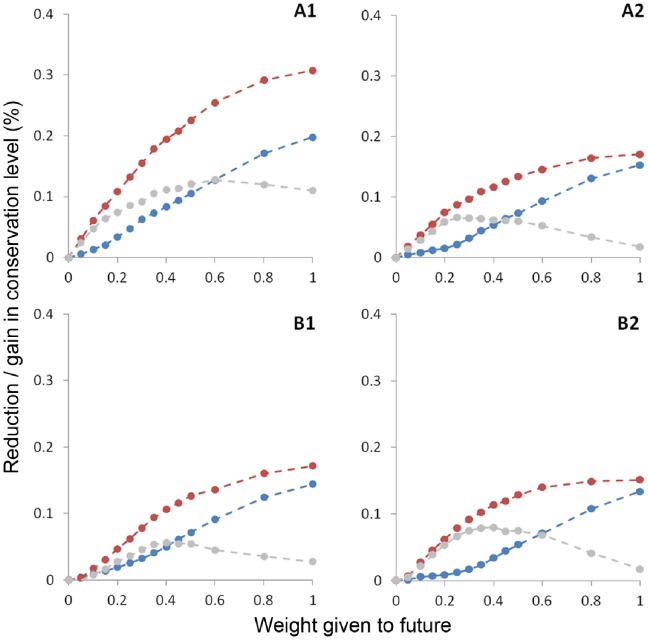
Figure 5. Trade-off curves for reductions in baseline conservation level (blue) and gains in future conservation level (red), as higher weight is given to the future, for the 4 SRESS scenarios.
Each point corresponds to a different set of spatial priorities, selected with a different combination of weights for baseline and future layers. Baseline always receives a weight of one, while weight for the future is varied from zero to one. The difference between gain and loss curves is indicated with a grey line.

