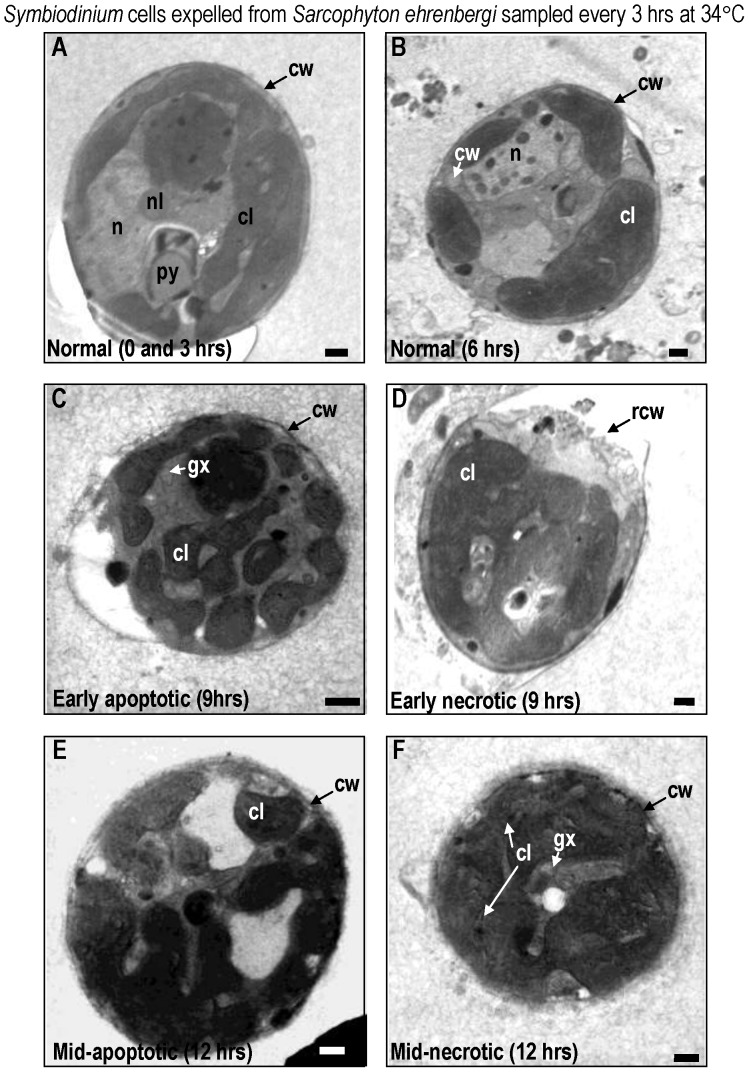
Figure 5. TEM images of Symbiodinium cells lost from Sarcophyton ehrenbergi through a 12 h period at 34°C, in sequence.
Images represent samples taken every 3 h. Note the early onset of specific stages of apoptosis (C) and necrosis (D) within the symbiont cells within 9 h. Within 12 h, mid- to late- apoptotic (E) and necrotic (F) stages represent non-reversible phases. Symbols: chr = chromosome, cl = chloroplast, gx = glyoxysome, m = mitochondria, n = nucleus, py = pyrenoid, sg = starch grain. Approximately 100 zooxanthellar (n = 100) cells were randomly examined per experimental temperature at each time interval, to help characterize normal, apoptotic, and necrotic processes. Scale bar = 500 nm.

