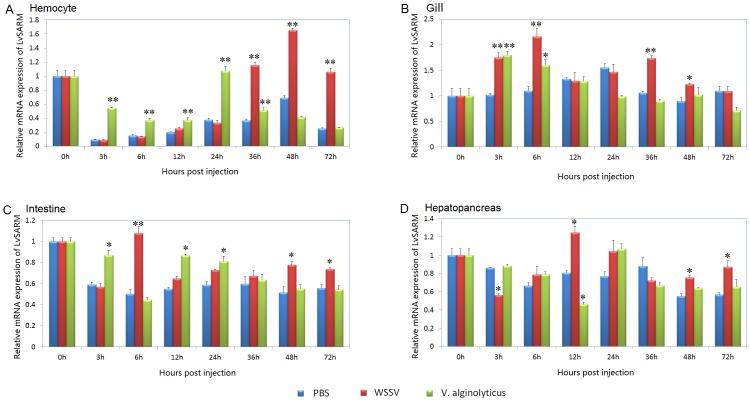
Figure 4. Expression of LvSARM in immune-challenged L. vannamei.
Temporal expression of LvSARM in the hemocyte (A), gill (B), intestine (C) and hepatopancreas (D) after challenge with V. alginolyticus or WSSV. The expression of LvSARM in the samples injected with PBS, WSSV or V. alginolyticus at 0 hpi was set to 1.0 as the control. Expression values were normalized to those of LvEF-1α using the relative standard curve method. qPCR was performed in triplicate for each sample. The data are expressed as the mean fold change (means ± S.E., n = 3) relative to the untreated group. The statistical significance was calculated using Student’s t-test (*p<0.05; **p<0.01).5. Correlation between LvSARM Induction and Shrimp AMP Expression in the Hemocyte and Muscle.

