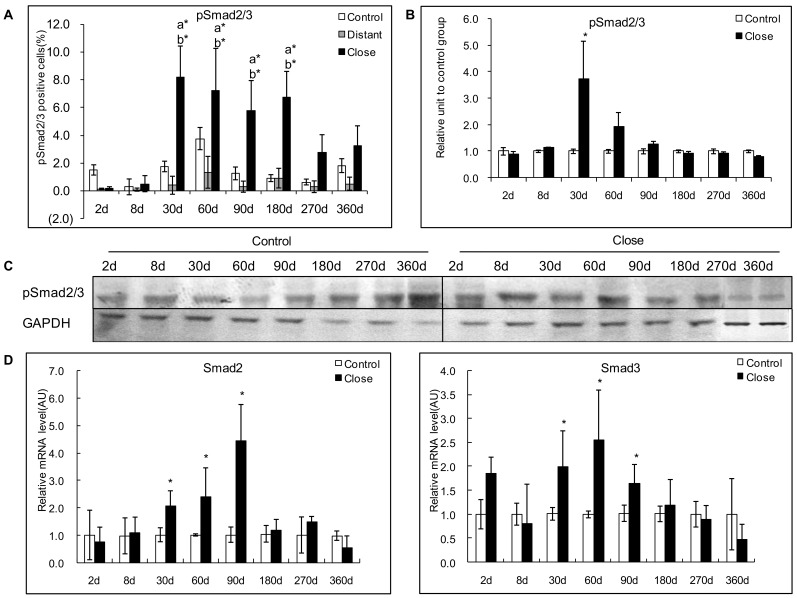
Figure 8. Course of pSmad2/3 expression in the liver of mice during E. multilocularis infection in experimental mice.
A: Course of pSmad2/3 expression observed by immune-staining in the liver from E. multilocularis infected mice compared to control mice, calculated as the percent of positive cells to the total number of counted cells (see Materials and Methods section). B: Relative amount of pSmad2/3 calculated from semi-quantitative analysis of the Western blot using densitometry. C: Representative example of the course of pSmad2/3 protein measured by Western Blot in experimental mice. D: Course of Smad2 and Smad3 mRNA expression measured by real time RT-PCR in experimental mice. a: ‘close’ versus ‘control’; b: ‘close’ versus ‘distant’. *P<0.05; **P<0.01. ‘Control’, non-infected mice; ‘Lesion’: E. multilocularis metacestode and surrounding immune infiltrate; ‘Close’: liver parenchyma close to E. multilocularis lesion; ‘Distant’: liver parenchyma distant from E. multilocularis lesion. AU: arbitrary units; GAPDH: glyceraldehyde-3-phosphate dehydrogenase.

