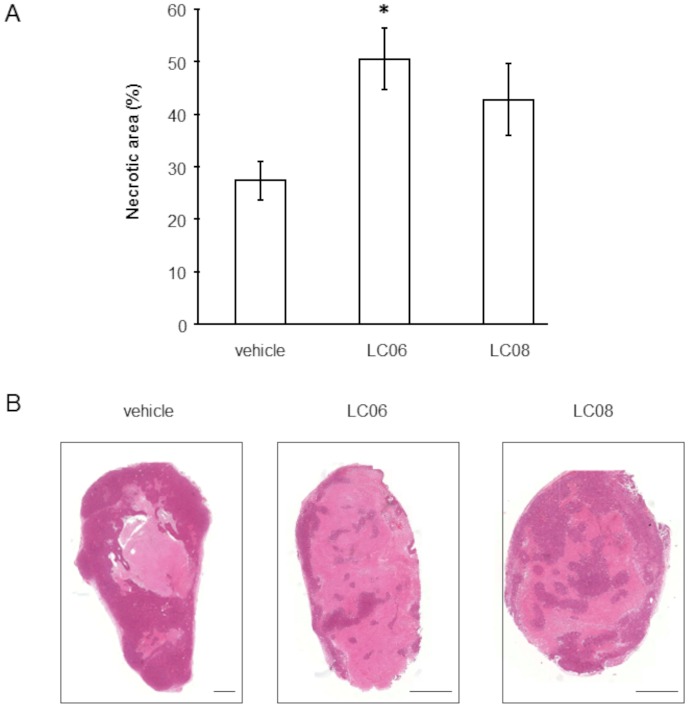
Figure 3. Tumor necrosis in LC06 and LC08 treated Colo205 tumors.
(A) Quantitative image analysis shows 27% of necrotic area in vehicle treated, 51% in LC06 treated and 43% in LC08 treated tumors (n = 5, *p<0.05 compared to control, Student's t-test). Results are expressed as mean ± SEM. Two independent experiments were performed to confirm the results. (B) Representative mosaic images (10x) of vehicle, LC06 or LC08 treatments. Scale bar represents 1.3 mm.

