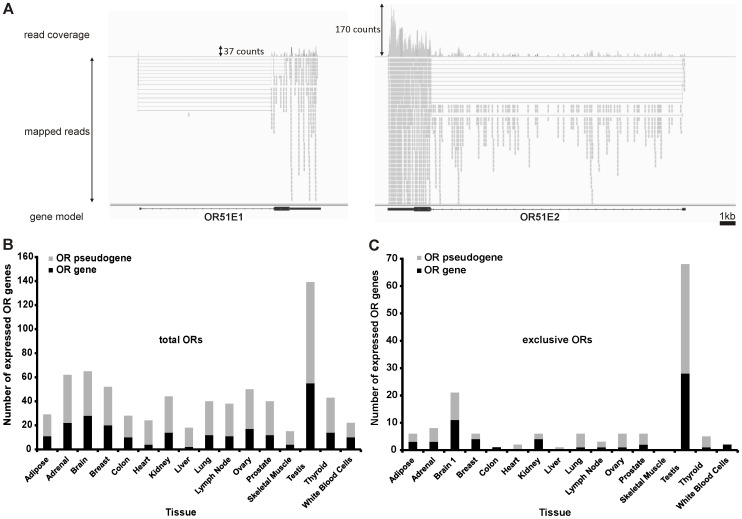
Figure 1. Detection of weakly and highly expressed ORs with RNA-Seq. A:
Sample representation of read coverage of weakly and highly expressed ORs detected in the prostate and visualized by the Integrative Genomic Viewer. The gray segments indicate reads that were mapped onto the reference genome. The gene is indicated by black bars (exon) and thin lines (intron). Above, the read coverage is shown (detected and mapped counts/bases at each respective position). B: Each bar represents the number of OR genes (black) or OR pseudogenes (gray) that were expressed in one of the 16 investigated tissues with an FPKM value >0.1. The largest number of ORs were detected in testis, brain and ovary; only a few ORs were detected in skeletal muscle and liver. C: The bar diagram shows the number of ORs exclusively expressed in each tissue. Exclusively expressed ORs have greater FPKM values than 0.1 in the tissue indicated and are expressed at FPKM values lower than 0.1 in all other tissues. Testis had the greatest number of exclusively expressed ORs. In skeletal muscle, no exclusively expressed ORs were detected.

