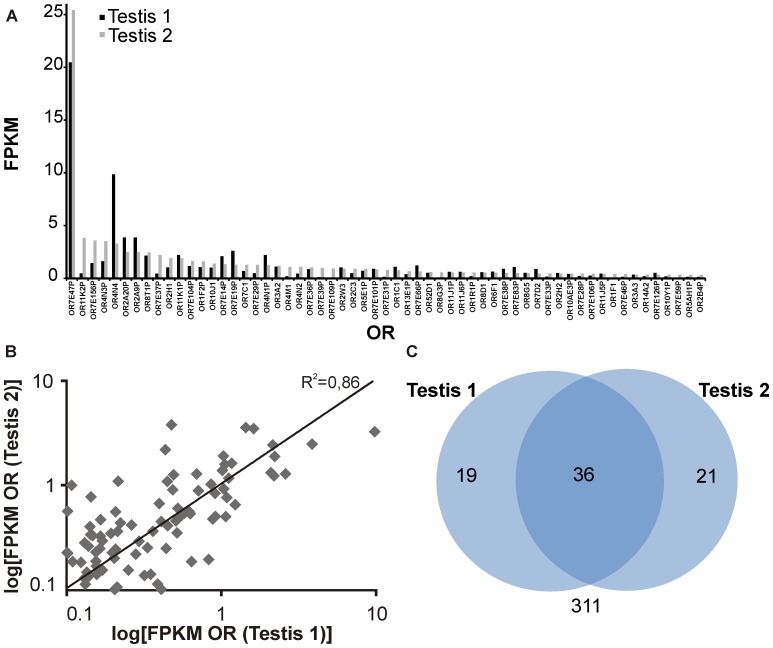
Figure 4. Expression of ORs in testis. A:
Expression profile for the 60 most highly expressed OR genes and pseudogenes in two testis samples, sorted by FPKM values of Testis 2. B: Plotted expression pattern correlation for all detected ORs in two testis samples. R2 is the coefficient of determination. C: Venn diagram showing the intersection of OR transcripts detected in two independent RNA-Seqs of human testis (FPKM >0.1). In both RNA-Seq analyses, we detected 36 identical ORs. (Testis 1 = Body Map 2.0; Testis 2 = Wang et al., 2008).

