
Figure 5. Protein expression profiles of Cedrus deodara pollen tubes cultured in the presence of different concentrations of anti-CaM (µg/mL).
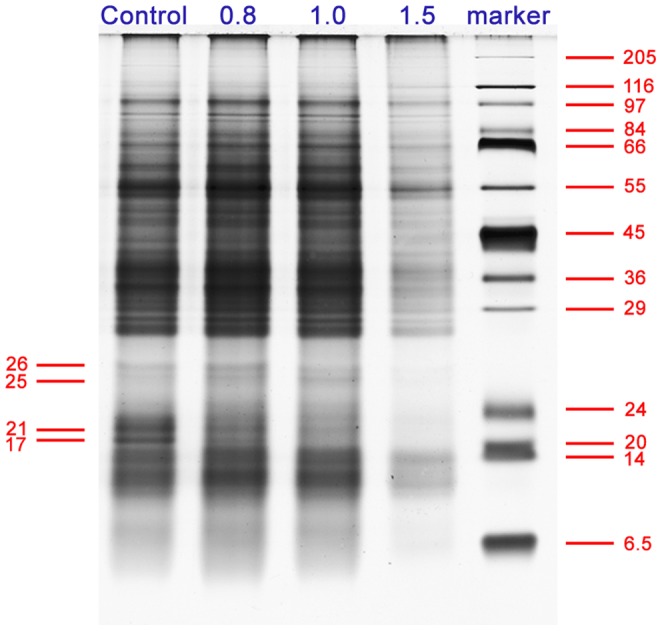
Proteins were extracted from pollen tubes incubated in standard medium (control) and in media containing 0.8, 1.0, or 1.5 µg/mL anti-CaM. Equivalent protein samples were separated by SDS-PAGE electrophoresis on 12% polyacrylamide gels (1 mm thick). Four bands showing significant changes in their expression levels were excised and subjected to further MS identification.