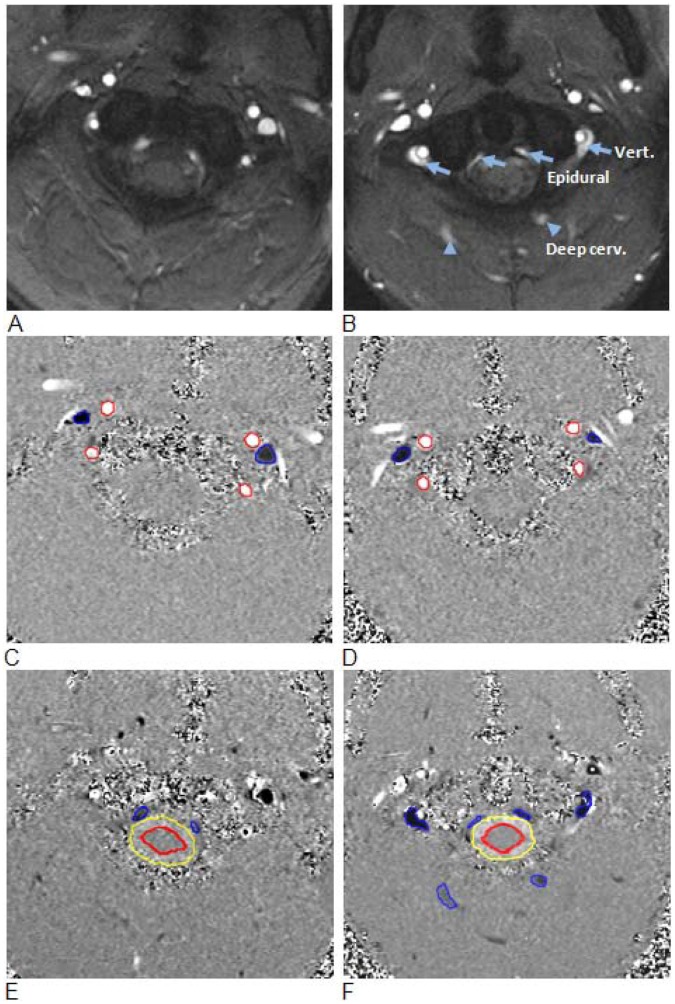
Figure 2. Examples of high and low velocity encoded phase contrast images from a control subject (left) and a subject with mTBI (right).
A–B: Flow compensated magnitude images showing the bright signal from blood vessels. The augmented venous outflow through the epidural, vertebral veins (arrows) and the deep cervical veins (arrow heads) is well visualized. C–D: High-velocity encoding images used for measurements of arterial inflow and venous outflow through the jugular veins. E–F: Low-velocity encoding images used for measurements of the flow through the secondary channels (epidural, vertebral, and deep cervical veins) and the CSF flow. The lumen boundaries (red – arteries, blue- veins and yellow and red – CSF and cord) were identified using the PUBS automated segmentation method.

