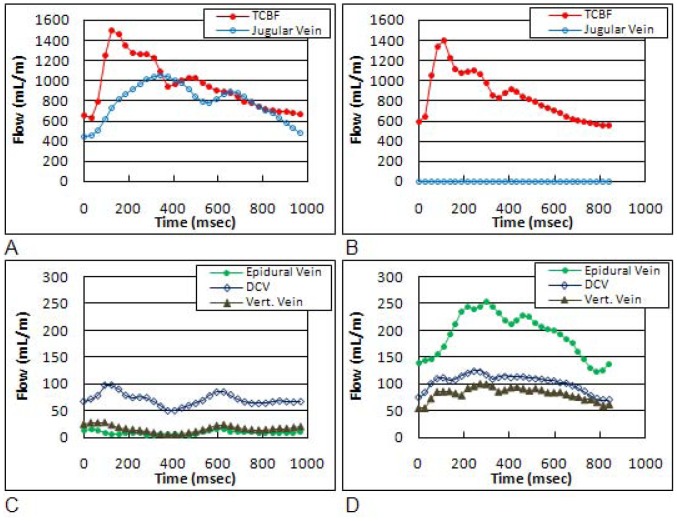
Figure 3. Derived volumetric flow waveforms obtained from a control subject (left) and a subject with mTBI (right).
The total arterial inflow (TCBF) and total venous flow though the jugular veins are shown in the top (Fig. 3A and 3B), respectively. The measured venous flow through the epidural, deep cervical, and vertebral veins are shown in the bottom (Fig. 3C and 3D).

