
Figure 3. Mean monthly rainfall (A) within years and (B) across years at each of the three sites.
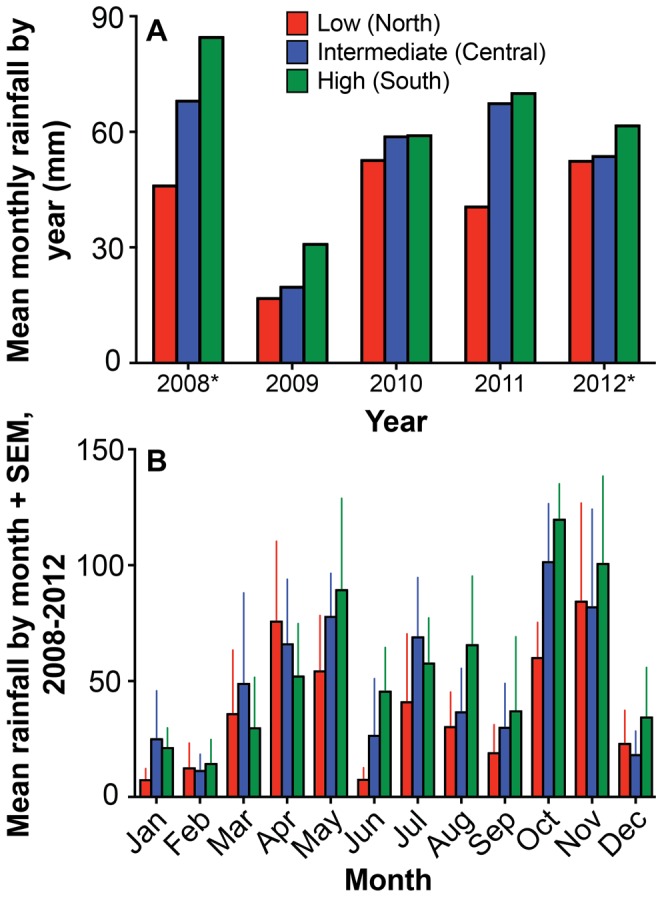
The asterisks next to years 2008 and 2012 in the top panel indicate that data were available only for 3 and 5 months, respectively.
Official websites use .gov
A
.gov website belongs to an official
government organization in the United States.
Secure .gov websites use HTTPS
A lock (
) or https:// means you've safely
connected to the .gov website. Share sensitive
information only on official, secure websites.
The asterisks next to years 2008 and 2012 in the top panel indicate that data were available only for 3 and 5 months, respectively.