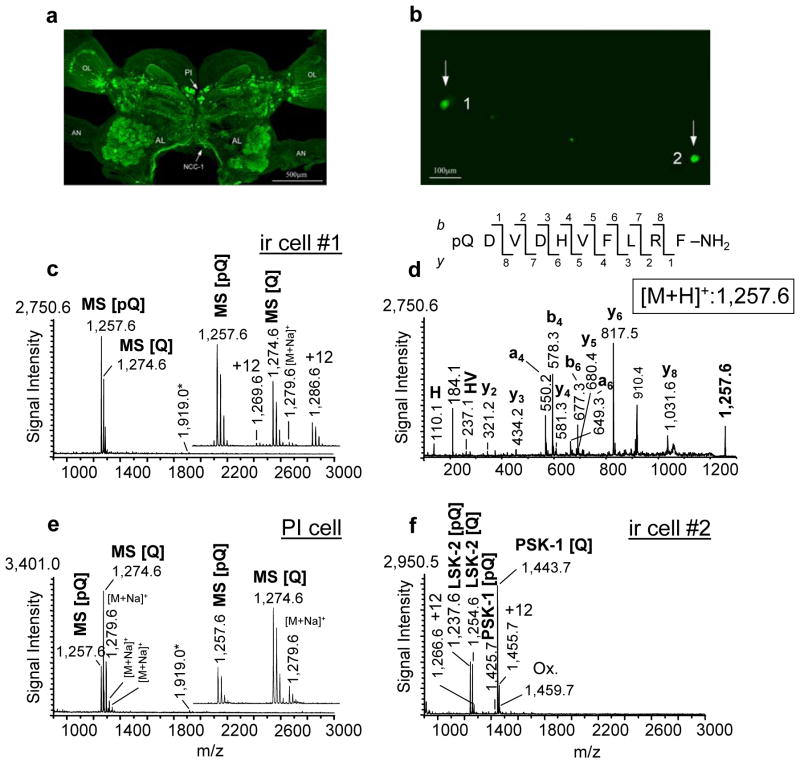
Figure 3. Single-cell mass spectrometry allows profiling and identification of analytes in individual PFIL cells.
(a) The distribution of anti-RFamide immunoreactivity in the whole brain of the cockroach P. americana as examined with confocal microscopy. Individual cells as well as different neuropil regions and axonal arborizations are visible (arrow PI, pars intercerebralis; arrow NCC-1; nervous corporis cardiaci-1). (b) Fluorescent image of two anti-RFamide-stained single-cells (ir cell#1 and ir cell#2; arrows) cultured onto an ITO glass slide(c) Mass spectrum of the cultured PFIL PI neuron (panel (b), cell #1). Note the concentration of the putative peptides in the mass range between 1,250 and 1,300 Da (see inset). An additional ion signal at [M+H]+ 1919.1 was observed in the mass spectra from myosuppressin-expressing neurons (arrow) represents hitherto an unknown product of the myosuppressin-gene remains an unanswered question because the myosuppressin-gene of P. americana is not known (see also Fig 3e). (d) CID mass spectrum of myosuppressin observed in the PI neuron at [M+H]+ 1,257.6. Prominent y-, b-, a-, an internal fragment ion and an immonium ion are labeled. (e) Mass spectrum acquired from a single freshly isolated myosuppressin-expressing PI cell (n = 15). No visible +12 Da ion adducts were observed (see inset). (f) Mass spectrum acquired from the cultured PFIL PI, (panel (b), cell #2) which expresses peptides encoded by a different RFamide neuropeptide family gene. Only unmodified and posttranslationally modified peptides encoded by the sulfakinin-(SK) gene are detected. LSK-2, Leucophaea maderae sulfakinin-2; PSK-1, Periplaneta americana sulfakinin-1; [Q], unblocked; [pQ], blocked form; ox, oxidation; OL, optical lobes; AL, antennal lobes; AN, antennal nerve.

