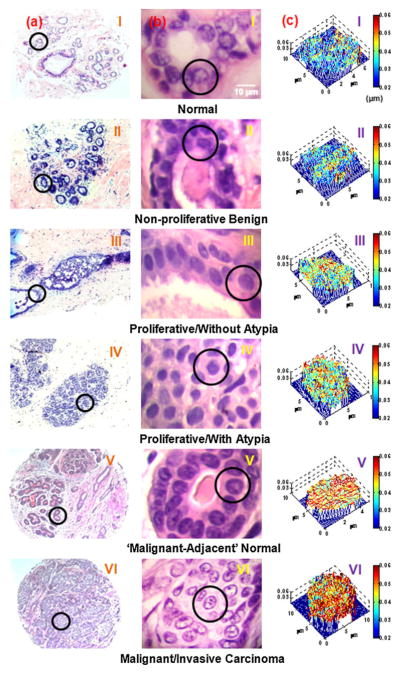
Fig. 1.

Representative conventional images of breast biopsies and structure-derived OPD map from a single cell nucleus. a Wide field histology images, b high-magnification histology images of breast tissue biopsies, and c corresponding OPD maps of the cell nuclei (marked in circles) from (I) normal cells from a healthy patient (Category 1); (II) cells labeled as fibrocystic changes from a non-proliferative benign patient (Category 2); (III) cells labeled as ductal epithelial hyperplasia from a patient with concurrent apocrine metaplasia and cystic changes (Category 3); (IV) cells labeled as atypical lobular hyperplasia (Category 4); (V) cells labeled by the expert breast pathologist as “normal” from a patient with invasive breast carcinoma (Category 5, “malignant-adjacent” normal); and (VI) cells labeled as “malignant” from a patient with invasive breast carcinoma (Category 6). Scale bar in the image indicates 10 μm. The color bar represents the OPD value from the cell nucleus
