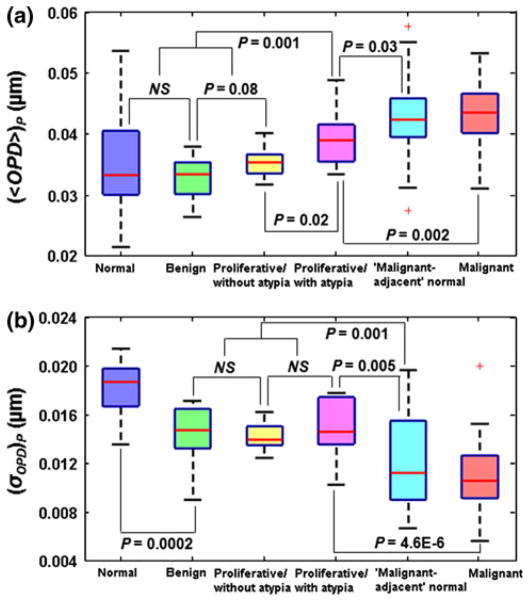
Fig. 3.
Box-and-whisker plots showing the changes in nuclear nano-morphology markers from all 6 categories with a broad range of breast pathology entities: a average nuclear OPD ((〈OPD〉)p) and b intra-nuclear standard deviation of OPD ((σOPD)p). For each patient, we used the mean value of 〈OPD〉 and σOPD by averaging ~40–60 cell nuclei. If P value is 0.1 or larger, “NS” is used

